
Stock Battle: Visa vs Mastercard!
Understanding the payments Duopoly!

Money is a medium of exchange that transfers value from one entity to another! For thousands of years, people have tried to find ways to simplify this exchange. Bartering is very slow and inefficient, so the early Babylonians used grain and silver. Gold and silver coins were used for thousands of years till paper money became the primary medium of exchange.
Nowadays, however, most of the world’s money is digital, and Visa and Mastercard are the beating hearts of our modern financial system. As paper money is increasingly disappearing from our daily lives, Visa and Mastercard are processing trillions of dollars of transactions.

Both companies have become so large and powerful that they have attracted the ire of politicians and business owners alike. Their monopolistic power enables them to charge high processing fees, operating effectively as a tool booth, a tax on all retail transactions.
But which of them is the better business? I will try to answer this question by looking through their finances and analyzing their valuation.
Let’s take a look at Visa and Mastercard!
1. The Basics
In 1958, Bank of America (BoA) was one of the first banks to release what is today known as a credit card. BoA’s BankAmericard became so successful that the bank decided to franchise the technology to other banks. The expansion led the system to become so massive that BoA started having trouble managing it. Ultimately, in 1970, Dee Hock, an executive of one of the franchising banks, persuaded BoA to separate BankAmericard into an independent company.
Dee Hock became the president and CEO of that independent company, and in 1976, the name was changed to Visa.

Over the years, Visa has expanded to almost all countries of the globe, becoming one of the largest financial technology companies in the world! Since its IPO in 2008, the stock has grown by over 1,800%. Today, with a market cap of over $600B, Visa is not only larger than BoA, it is larger than all US banks except JP Morgan Chase.
Mastercard came into existence in 1966 as the Interbank Card Association. Interbank was a cooperative of member banks specifically created to compete with Visa. As part of BoA, BankAmericard’s network rejected many requests from banks that wanted to join the network. BoA didn’t want to help their competition, creating a need for a competing product. In 1979, Interbank changed the name of the company to Mastercard.

Mastercard transformed from a cooperative into a separate company and had its IPO in 2006. Since the IPO, Mastercard has become one of the best-performing stocks of the last 20 years, growing 11,682% to reach a market cap of $485B. Today, similarly to Visa, Mastercard processes trillions of USD of transactions and operates in almost all countries.
2. Business Model
Visa and Mastercard operate payment processing networks acting as an intermediary between merchant and cardholder banks, facilitating quick, secure, and reliable commerce. Neither Visa nor Mastercard issue cards or loans themselves, that is done by their partner banks.
Every time a customer pays with a bank card, the merchant is charged a fee, usually around 1% to 4%. That fee is then split with the bank that issued the card, the acquirer that processes the payment (Adyen, Stripe, or Square), and the payments network (Visa, Mastercard, or Amex). Visa has a take rate of around 0.2%, whilst Mastercard’s take rate is 0.3%.
Essentially, Visa and Mastercard operate the train rails of the global payments system. Banks are the train stations. Adyen, Stripe, and Square act as trains that use the rails to transfer funds between train stations(banks)!
Both have favorable working capital dynamics as they collect their fees instantly while they pay employees and suppliers later. Additionally, the fact that it takes time for funds to move from a customer's bank account to the merchant means that the card network gets to hold the funds for a few days.
A few days might not seem much, but on a gigantic scale, this float gives Visa and Mastercard billions of dollars to invest in short-term securities that generate interest income. This idle cash, while technically isn’t theirs, is still on the balance sheet, and companies can use it.
3. Network Statistics
The nature of the payments processing business means that both companies are highly incentivized to grow their networks.
While both companies operate at a truly mind-boggling scale, Visa clearly takes the top spot!

The Visa network was used to process $15.7T of transactions, an increase of 148% since 2012, a CAGR of 8%. Meanwhile, Mastercard processed $9.6T, an increase of 162%, a CAGR of 8.5%.
Whilst Mastercard is growing faster, it is not growing fast enough to catch Visa, barely growing its volume as a share of Visa’s volume. In 2012, Mastercard processed 58% as much as Visa, today, the share has risen to 61%.

Mastercard has grown transaction volumes faster than Visa 5 out of the last 9 years, and its decrease during Covid was lower.
The absolute dollar difference has, however, increased from $2.7T in 2012 to $6.1T!
Visa has issued 4.4 billion cards, 1.5 billion cards more than Mastercard’s 2.9 billion. However, Mastercard has grown cards issued significantly faster than Visa.

Since 2012, Visa has grown its card network by 112%, a CAGR of 7.07%, whilst Mastercard’s card network has grown by 188%, a CAGR of 10.1%.
Now that we have the number of cards on the network and processed volumes, we can calculate the spend per card.
Visa’s volume per card has grown from $3,009 to $3,371, a 12% increase!
Meanwhile, Mastercard’s volume per card decreased by 10%, from $3,651 to $3,293!
Mastercard’s volume per card has fallen as the company has grown volumes and cards issued at a faster pace than Visa. This growth has likely been driven by expansion in debit cards that have lower spending per card and geographical expansion in less affluent developing regions such as Africa, Asia, and South America.
Similarly, Visa’s spending per card grew only by 12% in a decade, much lower than inflation, because the company prioritized total volume growth. Visa increased its reach internationally. Furthermore, Credit and Debit card popularity among affluent people was higher than among the general population. Thus, as Visa expanded beyond the affluent to the mass market, the spending per card didn’t grow as fast as the inflation.

In the last 12 months, Visa processed 234 billion transactions, compared to 199 billion processed by Mastercard.
Both companies have enjoyed strong growth, increasing the transactions processed by over 330%, CAGR of 13%!
In 2012, each Visa card was used around 25 times a year, so twice a month. Today, the usage has grown to 53 times a year, more than doubling. In a similar fashion, Mastercard’s usage has grown from 46 times to 69.
As digital payments are growing in popularity, cardholders of both companies are using their cards more frequently despite many people having multiple cards. This trend is likely to continue as people move towards a fully digital future.
4. Financials
Sales Growth
Looking at the sales growth, the story is the same as we saw in network statistics. Mastercard has grown slightly faster than Visa, but that hasn’t been enough to catch it and in absolute dollar terms the difference has only increased.
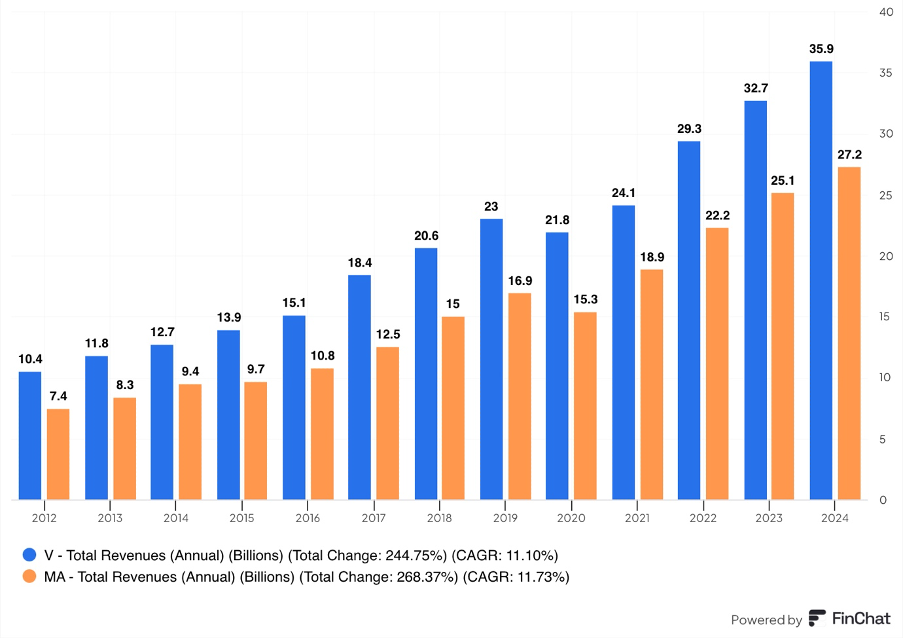
Visa’s sales in the last 12 months as of Q3 2024 reached $35.9B, an increase of 245% since 2012, a CAGR of 11.1%!
Whilst, in the same period, Mastercard grew sales by 268%, a CAGR of 11.7% to reach $27.2B!
In 2012, Mastercard’s revenue was 71% of Visa’s, with a $3B difference. Today, the difference has increased to $8.7B, despite Mastercard earning 76% as much as Visa.
Sales growth was driven by their expanding global payments networks, with transaction volumes, cards issued, and usage per card all improving noticeably. These dynamics will continue, supporting sales growth into the next decades!
Margins
Both companies have created the highest margin business in the world!

In the last decade, Visa’s operating margin jumped from an already impressive 60% to a mind-boggling 66.6%. At the same time, the net profit margin rose from 20.6% to 55%.
Mastercard’s operating margin grew from 53.5% to 58.4%, whilst the net profit margin went from 37.3% to 45.3%.
Both companies enjoy massive scale economies. It takes decades and many billions to build a sophisticated global payments network, but once it is built, the operating costs are relatively small.
Each incremental dollar processed through the network is more profitable than the previous, as operating costs don’t grow in tandem with the network!
It is quite likely that the margins of both companies will continue improving, despite competitive and regulatory pressures increasing. Visa and Mastercard are just too entrenched in the global financial system. As the trends driving increased adoption of digital payments are unlikely to stop, their scale will increase, supporting further margin improvements.
Profitability and Cash Flow
A huge scale and high margins lead to astronomical profits and supreme free cash flow!
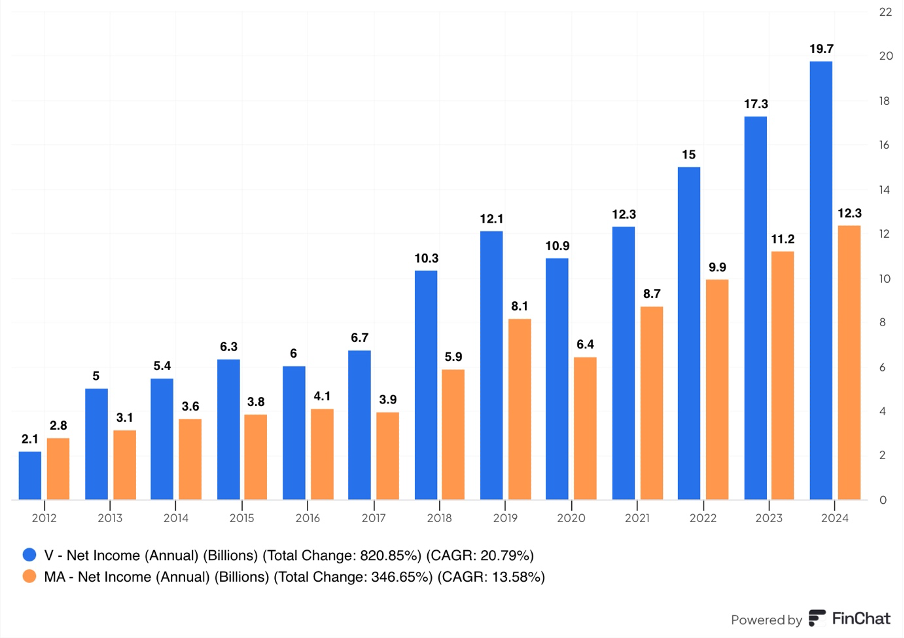
In the last 12 months, Visa generated $19.7B in net income, an increase of 821%, a CAGR of 20.8%.
Meanwhile, Mastercard posted $12.3B in net income, growing it by 345%, 13.6% CAGR!
As I mentioned earlier, scale enables both to operate a more efficient business than in 2012. When operating leverage kicks in, profits tend to explode.
Both companies grew profits faster than sales. Visa grew sales with an 11.1% CAGR compared to a 20.8% profit CAGR. Meanwhile, Mastercard’s profit growth rate of 13.6% was also above the 11.7% sales growth rate.
Additionally, favorable business dynamics allow both companies to hold onto cash while it is being processed!

If we compare the net income and FCF graphs above, we notice that both regularly generate more FCF than net income!
This is quite rare, as companies often struggle to collect cash from their customers. Fortunately, Visa and Mastercard don’t need to worry about this, with FCF margins above 50%.
Visa and Mastercard generate incredible free cash flow because of their asset-light, highly scalable businesses with low capex requirements and favorable working capital dynamics!
Key Ratios
In the below table, I have placed some key ratios for both companies.

Before discussing the differences, let me say that from the ratios it is clear that both companies run low indebtedness, low capex, and high returns businesses!
Visa and Mastercard both have just shy of $7B in net debt, however, relative to their asset base, Mastercard has double the debt, with a 0.4 debt ratio compared to Visa’s 0.2. Nevertheless, Mastercard’s EBIT/Interest ratio of 26.1 and Net Debt/EBITDA of 0.4 mean it will not have any problems paying its liabilities.
While Visa has less debt than Mastercard, its return ratios, while still impressive, are much lower than Mastercard. ROIC is 17% points lower, ROA is 27%, while ROE is 3 times.
Factors driving this difference include Mastercard’s higher leverage reducing shareholder equity. Furthermore, Visa’s higher asset base includes $37B more intangible assets than Mastercard due to mergers.
Valuation
In the previous sections, we established that Visa has a larger network, better margins, and less debt, however, it has grown slower in the last 10 years. Which company is a better buy today depends on the valuation, so let’s look at it.

The above table shows us that Mastercard is a more expensive company as investors expect it to continue growing faster than Visa!
Both companies trade at above-average market multiples because they are high-quality monopolistic businesses that are likely to grow sales, profits, and cash flow by more than 20% in the next 2 years.
On a TTM basis, Mastercard is 26% more expensive with a P/E of 40 versus Visa’s 31.7. Forward-looking 2027 ratios are higher as well, with P/E being 14% more expensive and P/FCF 39%. Moreover, Visa’s dividend yield is 37% higher, whilst the buyback yield is 30% higher.
Paying 26% more for Mastercard on a TTM basis, investors get 22% higher topline growth (25.5% vs 20.9%), 37% higher EPS growth (30.9% vs 22.6%), and 3% extra FCF growth (30.5% vs 29.7%).
5. Future
Death of Paper Money
The use of paper money in the developed world has been steadily falling for many decades. However, the popularity of various alternative payment methods, such as digital wallets, prepaid cards, and mobile QR codes, has also accelerated the decline of paper money in the developing world.
In April of 2023, The Guardian reported that in light of the weakest demand it has seen in 20 years, the world’s largest commercial printer of banknotes, De La Rue, issued a profit warning to its investors. Many factors are driving this shift in preferences:
Speed – digital payments are faster than cash transactions, as there is no need to count the cash, wait for the change, and manage the banknotes.
Convenience – it is significantly more convenient to just tap your card or phone than to deal with banknotes. For businesses, it’s also easier to not deal with cash instead receiving the funds right to their bank account.
Infrastructure - widespread access to smartphones and the internet has enabled digital payment systems to reach previously cash-dependent populations.
Security – digital transactions reduce the risk of theft associated with carrying large amounts of cash for individuals and businesses.
Digital services – the growth of digital services such as E-commerce, ride-hailing, food delivery, and subscription services supports the increased adoption of digital payment methods.
The use of digital payments is likely to continue growing worldwide, benefiting both companies.

Analysts at Straits Research estimate that the global digital payments market will grow with a 19.16% CAGR to reach $464.28B in revenue by 2032.
Antitrust
Visa and Mastercard are essentially a duopoly that controls the rails of modern finance, charging a tool fee to everyone. Both companies hold an outsized influence on the digital payments industry, leading to higher prices for banks, merchants, and customers.
While no one argues the services Visa and Mastercard provide are not crucial, regulators are increasingly getting frustrated with the high fees and the anticompetitive behavior of both companies. Governments across the world have started to implement new rules and regulations specifically designed to limit Visa’s and Mastercard’s power, limiting fees and encouraging new competition.
In the EU, interchange fees are limited to 0.3% for credit cards and 0.2% for debit cards. While in Brazil and India, the government is actively promoting the use of local payment networks. Regulatory pushback is likely to continue, leading to slower network growth and intensifying competition.
Analytics and Services
As regulators claw back some of the economics, global competition intensifies, and the scale of their networks reaches maturity, both companies will increasingly seek new ways to monetize their networks.
As they have strong relationships with banks, payment processors, and other partners, it is not that difficult to offer new services. Cybersecurity is a domain that is growing in importance, so both companies are offering various solutions that help banks with fraud prevention, authentication, and security. Data analytics is another segment both companies think has potential. As they process billions of transactions worth trillions of dollars, without a doubt, there are insights that could be valuable.
A few months ago, in September of 2024, Mastercard announced a $2.65B acquisition of a cybersecurity company, Recorded Future. The same month Visa announced a $935M deal to buy payment protection firm Featurespace. These types of small bolt-on acquisitions designed to add more services are likely to continue.
Visa’s “Other Revenue” segment earned $3.2B this year, whilst Mastercard’s “Value-added Services” segment earned $10.4B. These segments include different things and are not really comparable, but they highlight both company's desire to grow their services businesses.
6. Conclusion
In conclusion, as the world continues its transition towards fully digital payments, Visa and Mastercard stand to benefit by running the train tracks that connect the global payments system.
Visa and Mastercard are high-quality monopolistic financial technology businesses with great margins and supreme economies of scale!
People love the convenience and ease of digital payments, driving more merchants to adopt them. Additionally, e-commerce and other digital services are increasingly becoming a bigger slice of the global economy, leading Straits Research to forecast a 19.16% yearly growth rate for the digital payments market. They estimate the segment will reach $464.28B in revenue by 2032.
Visa and Mastercard volumes are likely to grow as a result of these changing global trends!
Despite intensifying competition and growing pressure to reduce fees, both are likely to continue growing due to how entrenched and powerful they are. Furthermore, there is a lot of surplus that will be invested to improve existing services and develop new ones, increasing the take rate.
Visa is a larger business overall, with higher margins, dividends, and buybacks. Additionally, the company has less relative debt, and Mastercard is 26% more expensive than Visa.
However, over the last decade, Mastercard has grown faster than Visa, and Wall Street analysts expect this trend to continue.
Investors need to decide what they prefer, I think both are priced fairly, considering their business dynamics and future growth prospects.
Thank you for reading, Follow me on:
X(Twitter): TheRayMyers
Threads: @global_equity_briefing
LinkedIn: TheRayMyers
Disclaimer: Global Equity Briefing by Ray Myers
The information provided in the "Global Equity Briefing" newsletter is for informational purposes only and does not constitute financial advice, investment recommendations, or an offer or solicitation to buy or sell any securities. Ray Myers, as the author, is not a registered financial advisor, and readers should consult with their own financial advisors before making any investment decisions.
The content presented in this newsletter is based on publicly available information and sources believed to be reliable. However, Ray Myers does not guarantee the accuracy, completeness, or timeliness of the information provided. The author assumes no responsibility or liability for any errors or omissions in the content or for any actions taken in reliance on the information presented.
Readers should be aware that investing involves risks, and past performance is not indicative of future results. The author may or may not hold positions in the companies mentioned in the "Global Equity Briefing" report. Any investment decisions made based on the information in this newsletter are at the sole discretion of the reader, and they assume full responsibility for their own investment activities.
I enjoyed reading this article, thank you!