
Is DLocal a Buy?
Stellar quarter, silly reaction.

In May, I released my Dlocal Investment Case, where I identified them as one of the most exciting emerging markets fintechs trading for a reasonable valuation. Since then, the company has continued to execute, giving me confidence to upgrade my 2030 valuation model.
However, the market continues to pay too much attention to the short term, missing the forest for the trees, as the stock fell 15% in after-hours trading after reporting Q3 results.
The market had such a negative reaction largely because DLocal’s gross profit take rate decreased from 1.07% in Q2 2025 to 0.99% this quarter. While certainly a negative development, this is a clear overreaction to a metric that is volatile every quarter and ignores all the great things about this quarter.
Strong Revenue, ADJ EBITDA, and EPS Beats.
5 quarters in a row of accelerating TPV growth.
Continued onboarding of new partnerships.
Improving operating leverage.
Truly exceptional customer retention.
In this report, I will expand on each of these and build a new 2030 valuation model.
1. Financials
2. Payment Volumes
3. Take Rate
4. Retention
5. Valuation
6. 2030 Valuation Model
7. Conclusion

1. Financial Summary

Dlocal Q3 2025 Earnings Presentation.
Total Payment Volumes: $10.4B +59% Y/Y, +13% Q/Q.
Revenue: $282M +52% Y/Y, +10% Q/Q. (Estimate of $263M)
Gross profit: $103M +32% Y/Y, +4% Q/Q.
ADJ EBITDA: $72M +37% Y/Y, +2% Q/Q. (Estimate of $69M)
Net Income: $52M +93% Y/Y, +21% Q/Q.
EPS: $0.17, 89% Y/Y, +18% Q/Q, (Estimate of $0.16)
ADJ FCF: $38M, +28% Y/Y, -22% Q/Q.
Dlocal delivered very strong top-line results, beating analyst expectations by $19M, around 7%.
And while analysts focus on the falling take rate, they completely ignore the operating leverage that is being built in the business!
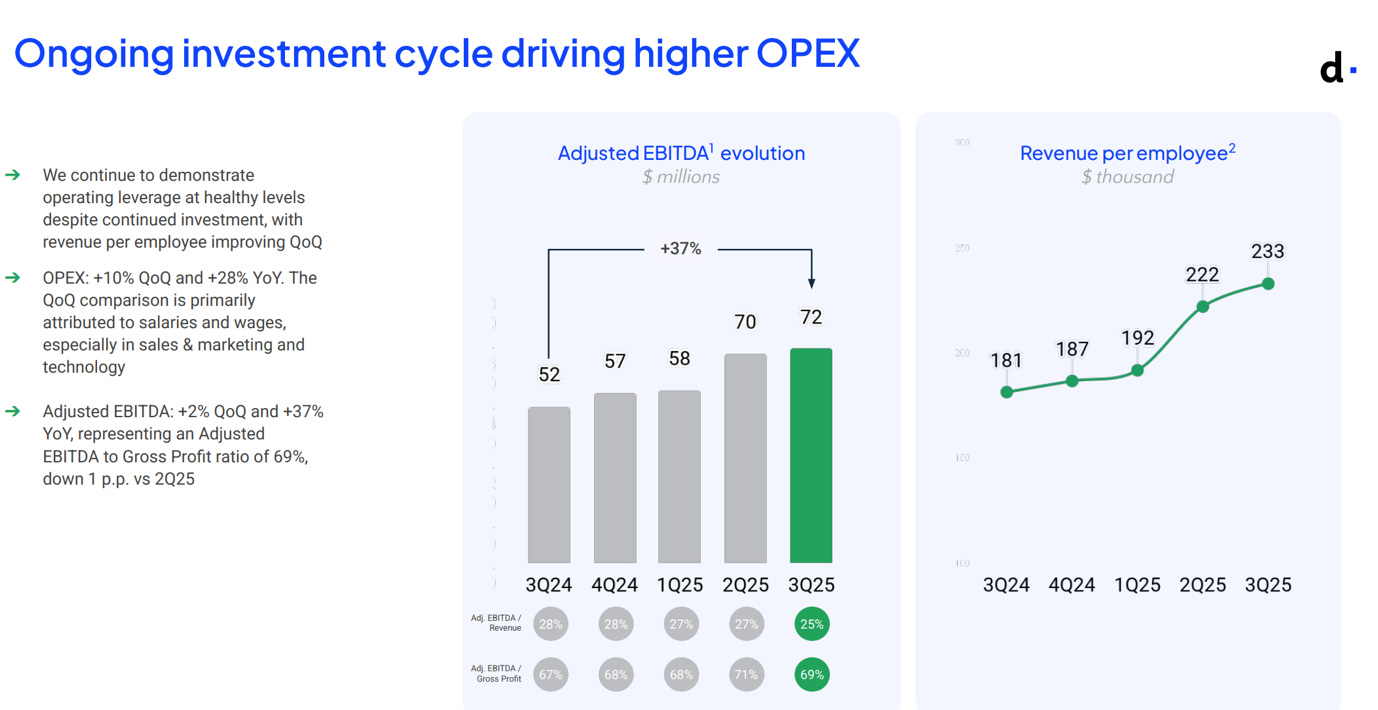
ADJ EBITDA grew by 37%, while operating expenses grew by a slower 28%. Moreover, revenue per employee grew by 28.7%, from $181K to $233. As Dlocal becomes a larger enterprise, it becomes more efficient, enabling it to generate strong earnings even as take rates decrease.
2. Payment Volumes
For a payments fintech, payment volumes are the most important metric that investors must track. Simply put, the more money that goes through Dlocal’s rails, the more money the company keeps for itself.
In Q3 2025, Dlocal grew payment volumes by an exceptionally strong 59.5% Y/Y, reaching $10.4B!

As we can see in the graph above, this was the first quarter that the company surpassed $10B in revenues, and it was also the 5 quarter in a row of accelerating payment volume growth.
Furthermore, as we can see in the picture below, payment volumes grew strongly across most of its core verticals!

E-commerce, the largest and most important vertical, grew by 89% Y/Y. This is an exceptionally strong growth that demonstrates the potential of this segment. Let’s remember that e-commerce penetration is still lower in emerging markets compared to developed ones, providing Dlocal with a strong opportunity.
Another outstanding performance came from the remittances vertical, which grew 226% Y/Y, driven by Dlocal’s many partnerships, including Western Union.
Other verticals also demonstrated strong growth, except for Advertising, on which I will expand a bit later.
Growth would have been even better if not for the weakness in Mexico and Egypt.
The company said that volume growth in Mexico was affected by an increase in tariffs. With sales for low-value goods imported from “certain countries” decreasing. This probably relates to Temu sales in Mexico for goods shipped from China. If not for this factor, the e-commerce vertical would have grown even more.
However, in Egypt, the company cited a loss of business from a large customer due to them implementing redundancy procedures. Large merchants always have more than one payment processor, so in case of issues, they can divert volumes to the other and also so to get better prices by putting both processors against one another.
Essentially, this means that the customer is using another payment processor for a large share of volumes. This could mean that the customer is shifting payment volumes to force Dlocal to offer more preferable payment terms. Revenues in Egypt decreased 55%, so the effect seems too large to be just redundancy.
In the TPV growth by vertical graph above, we see that advertising volumes decreased by 33% Y/Y. This could relate to the Egyptian business and could mean that the merchant whose wallet share Dlocal is losing could be Meta or Google. Just speculation.
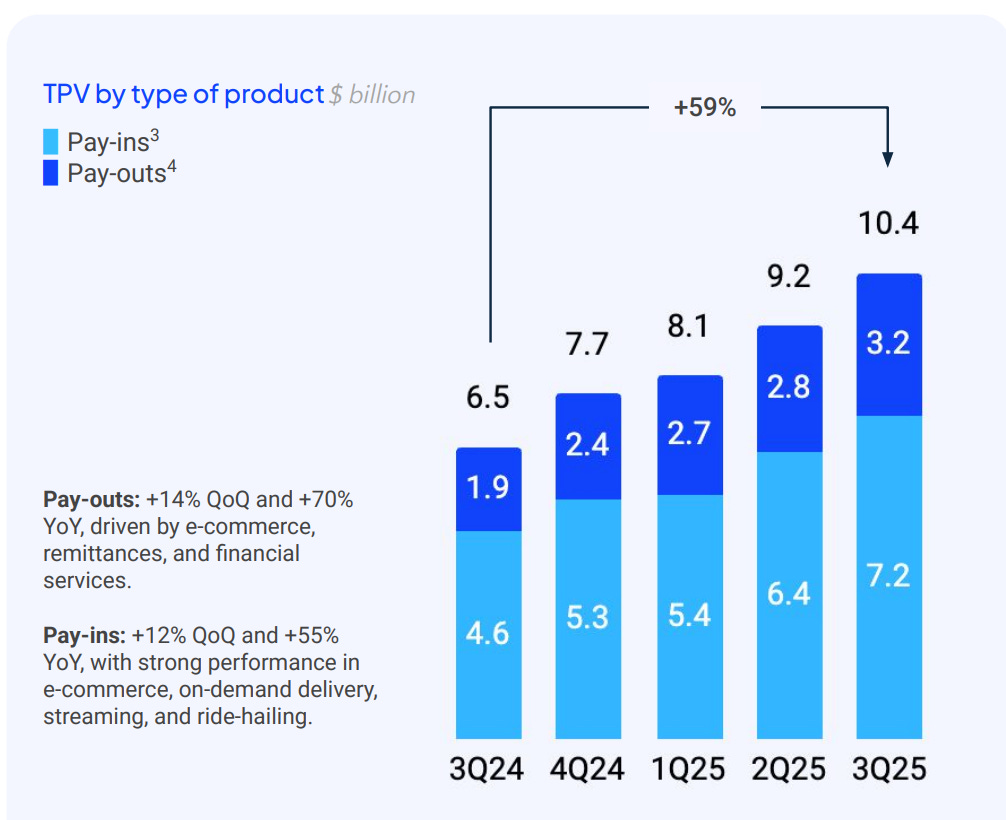
Pay-outs continue growing faster than pay-ins, driven by the already mentioned strong growth in the remittances segment. Pay-outs are now 30.8% of TPV, an increase from 29.2% in Q3 2024. As Dlocal has barely scratched the surface in the remittances vertical, and it is growing strongly in ride-hailing and delivery, the share of pay-outs will likely continue increasing in the future. This will have a negative effect on the take rate, these activities have lower fees, but we will discuss that in the next section.
3. Take Rate
Dlocal defines its take rate as gross profit divided by total payment volumes.
In Q3 2025, Dlocal reported a take rate of 0.99%, a significant decrease from 1.07% in the prior quarter and 1.2% in Q3 2024!
As we can see in the graph above, there is a clear downtrend of falling take rates, with the take rate halving in 3 years.
Every once in a while, you have quarters where the investor base panics over the take rate, and this quarter is a perfect example. The thought process is very simple, if Dlocal keeps less money for itself from every dollar it processes, its growth suffers. However, this is a very simplistic thinking that ignores all other factors that also drive earnings growth.
Essentially, 3 factors largely determine a take rate, and each of them might have a larger effect in a particular quarter.
First, the financial terms under which the company has agreed to process payments for a merchant. A large customer renegotiating financial terms could have an outsized impact on the take rate.
Second, transaction processing costs. Dlocal operates a payment aggregator business where it handles the front-facing relationship with a merchant, whilst it integrates services from other payment acquirers, merchant banks, FX services, and more. Sometimes they earn higher FX fees, allowing the take rate to increase, whilst at other times the company incurs higher processing costs, reducing the take rate.
Third, payment volume split between payouts and pay-ins. Dlocal simplifies the payout processes for e-commerce, ride-hailing, and travel companies. However, these transactions are less complex and usually happen in batches, thus Dlocal charges lower fees to merchants for handling them.
This quarter, we saw a mix of all 3.

I really love the above chart from Dlocal, where the company easily bridges the difference in take rate from Q2 to Q3, explaining how Dlocal lost 8 basis points in take rate. I would love all payment companies to disclose so much.
As we can see, a 0.01% reduction in take rate was due to a larger share of pay-outs. Pay-outs are 30.8% of TPV, and as their share increases, they will continue putting downward pressure on the take-rate.
Another basis point was lost because of the lost business wallet share in Egypt.
2 basis points were lost due to lower FX rate spreads in Bolivia and Argentina.
However, half of the 8 basis point take rate decline was caused by a rather vague category as “Others”. There was little explanation for it in the earnings release, so I was hoping that they would expand on it in the earnings call.
“That is not necessarily a continued compression of take rate. I think if you were to call it a normalized take rate, pulling out one-offs, it would have remained above 100 basis points for the quarter. We have always pointed to the fact that I think the general trend for take rate, we believe, is still potentially downward, but with a volatile trajectory and not necessarily at a very fast pace.” Dlocal Q3 2025 Earnings Call
So, not a very detailed response elaborating on the nature of this 4 basis point loss, just that many causes are one-offs, and Pedro doesn’t see this as a continued downward move. So the general trendline of take-rate is down, but not at a very rapid pace, but there will be quarters where take-rates increase and decrease substantially.
In the long term, Dlocal believes that its take-rate is more defensible than many analysts think.
“Let me remind you that remittances is particularly important because it generates outbound flows into the emerging world. That makes us somewhat unique in that we are one of the global PSPs, if not the one, with the best balance between pay-ins and pay-outs, which generates cross-selling opportunities across merchants, but also allows for interesting netting opportunities, which keep the take rate on our businesses more defensible given those netting opportunities where we keep the entire FX spread.” Dlocal Q3 2025 Earnings Call
This is a crucial point. As Dlocal processes both money coming into a country and money leaving it, the company can settle some of these flows locally inside a country, improving transaction economics.
For example, if they process $1,000 coming into Egypt from the US in the form of a remittance and $1,000 going out to the US to pay a US-based SaaS company, they can settle these payments locally. They use the $1,000 inside the US to pay the SaaS company, and $1,000 equivalent in Egyptian Pounds to pay the remittance.
As there is no money actually moving borders, transaction costs are lower, and Dlocal can keep the whole FX spread, instead of paying a bank to convert currency.
This is just one example in which Dlocal will continue finding ways to extract more value from its business and achieve better economics. I think analysts focus too much on how many basis points Dlocal lost or gained in the take rate in a particular quarter. This is largely due to their Excel brain being so coded to track easily trackable KPIs.
The bigger picture is that payment volumes are growing incredibly quickly across verticals and geographies!
Dlocal might keep a smaller share of each dollar processed because of the nature of and economics of these money flows changing, but that doesn’t matter, as each dollar they process is still quite profitable.

As we can see in the graph above, despite the take rate falling by 59% from 2019 to 2024 (orange line), Dlocal’s EPS grew by 609% (blue line).
I know which metric I care about!
4. Retention
Dlocal customer retention is simply incredible!