
Is The Trade Desk’s Growth Engine Starting to Stall?
A guest article from Sergey at Compounding Your Wealth.


Hello Global Investors.
Today, I am bringing you a guest article from my friend Sergey at Compounding Your Wealth.
Sergey analyzes growth stocks, primarily software and SaaS companies with strong competitive advantages and sector leadership, in “Compounding Your Wealth” newsletter. He breaks down quarterly earnings reports, focusing on the key metrics. Sergey also publishes Deep Dives on companies — covering their KPI dynamics, valuation trends, and the economic moats that drive business resilience and long-term growth stability.

The Trade Desk $TTD remains the dominant independent force in programmatic advertising, anchored by its AI-driven Kokai platform, deep CTV partnerships, and a customer retention rate above 95%. The Trade Desk continues to expand within a $1 trillion global advertising market, with CTV expected to grow 21.2% annually. Shares have fallen over 60% from their highs, leaving valuation multiples near historical lows, and profitability remains intact with strong free cash flow. Yet a key question now shadows the optimism—is revenue growth stabilizing or losing momentum?
Table of Contents:
1. Company Overview – A brief summary of the company, including its mission, sector, competitive advantage, and total addressable market (TAM).
2. Valuation – Analysis of changes in Forward EV/Sales and Forward P/E multiples, along with comparisons to peers within the same sector.
3. Economic Moat – Evaluation of the company’s moat across five key types: Economies of Scale, Network Effect, Brand, Intellectual Property, and Switching Costs.
4. Revenue Growth – Review of revenue growth dynamics over the past two years.
5. Segments and Main Products – Overview of the company’s business segments, latest quarterly performance by segment, product innovation.
6. Market Leadership – Assessment of the company’s leadership status in its segment, as recognized by reputable rating agencies like Gartner, The Forrester Wave, etc.
7. Customers – Analysis of customer growth trends, customer success stories, and major customer wins. Strategic Partnerships and International Expansion.
8. Key Performance Indicators (KPIs) – Review of Retention, profitability, operating expenses, balance sheet strength, and shareholder dilution.
9. Conclusion – Final thoughts and summary based on the above analysis.
1. Company overview
About The Trade Desk
The Trade Desk, is an American multinational technology company founded in 2009 by Jeff Green and David Pickles. Headquartered in Ventura, California, the company provides real-time programmatic marketing automation to personalize digital content delivery. As the largest independent demand-side platform (DSP), TTD competes with Google’s DoubleClick and Facebook Ads. It went public on September 21, 2016, debuting at $18.00 and closing at $30.10 on IPO day. Revenue grew from $308 million in 2017 to $2.44 billion in 2024, with $393 million in net income. TTD employs approximately 3,522 people across 25 offices worldwide.
Company Mission
TTD’s mission is to transform how advertising is bought and sold by giving brands and agencies tools to reach audiences with precision. It focuses on innovation, transparency, collaboration, and accountability to drive performance and maintain leadership in digital advertising. The mission fuels the development of tools that deliver relevant and measurable ad experiences.
Sector
TTD operates in the digital advertising technology space, specializing in programmatic advertising. Its cloud-based platform allows advertisers to plan, manage, and optimize campaigns across devices and channels using real-time data. Programmatic decisions are made in milliseconds, driven by identity, context, and device data. TTD is known for its omni-channel approach and sustained 95% customer retention rate for 27 consecutive quarters as of 2020.
Competitive Advantage
TTD’s advantages include transparency, AI-driven targeting, and a business model that aligns with client interests. It does not own ad inventory, avoiding conflicts of interest. Customers retain ownership of their data. The platform integrates over 1,200 machine learning models, achieving 92% AI-powered targeting accuracy. TTD’s Unified ID 2.0, with 200 million+ authenticated users in 2023, provides a privacy-forward alternative to third-party cookies.
Total Addressable Market (TAM)
The Trade Desk operates within a global advertising market nearing $1 trillion in TAM, with specific estimates placing its opportunity at over $935 billion. The company focuses on digital channels, the fastest-growing segment within that market.
The global digital advertising market is projected to reach $786.22 billion by 2026, driven by accelerating budget shifts from traditional to digital media. Core growth areas include Connected TV (CTV), retail media, and international expansion, all aligned with TTD’s platform strategy.
The overall digital advertising market is expected to grow at a 12% CAGR. Within it, CTV advertising, a key focus for TTD, is forecast to grow at a 21.2% CAGR, reaching $31.47 billion by 2027. The AI in advertising market—critical to TTD’s tech-driven advantage—is projected to expand at a 32.5% CAGR, hitting $107.3 billion by 2028.
2. Valuation
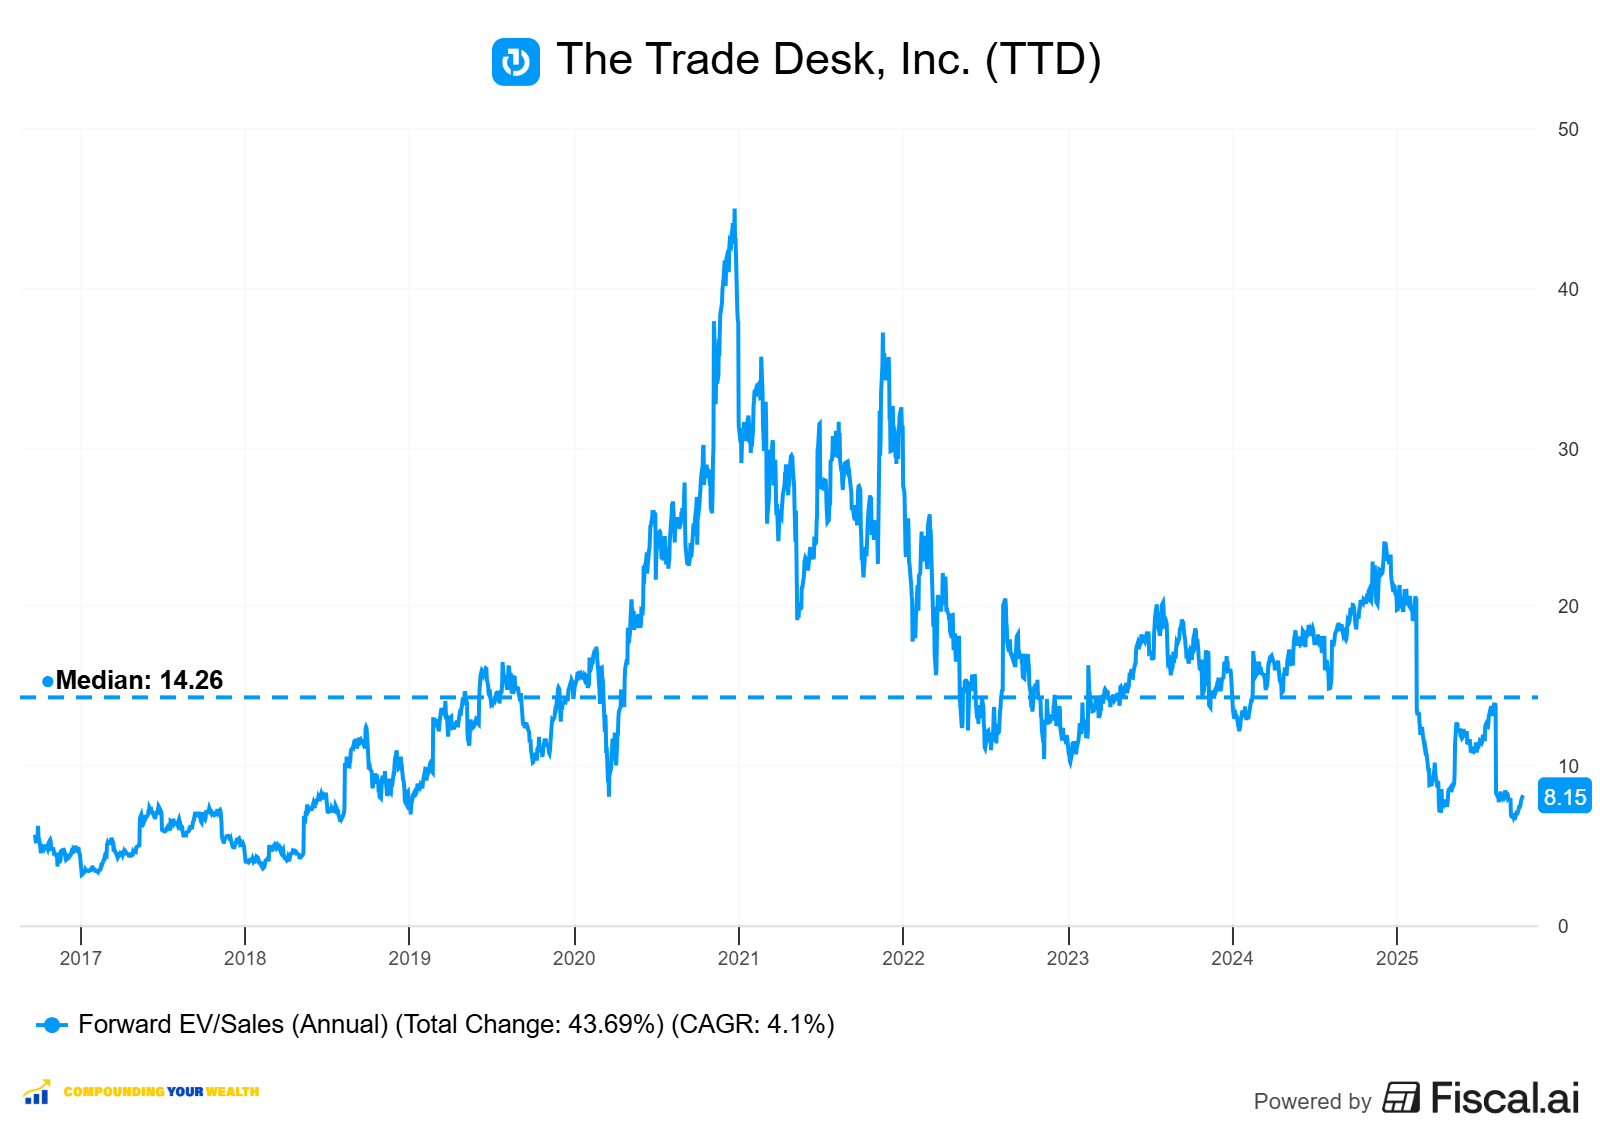
$TTD The Trade Desk is currently trading at a forward EV/Sales multiple of 8.1, which is below its median of 14.2. As of January 2023, it is also near the lows seen between 2019 and 2024.
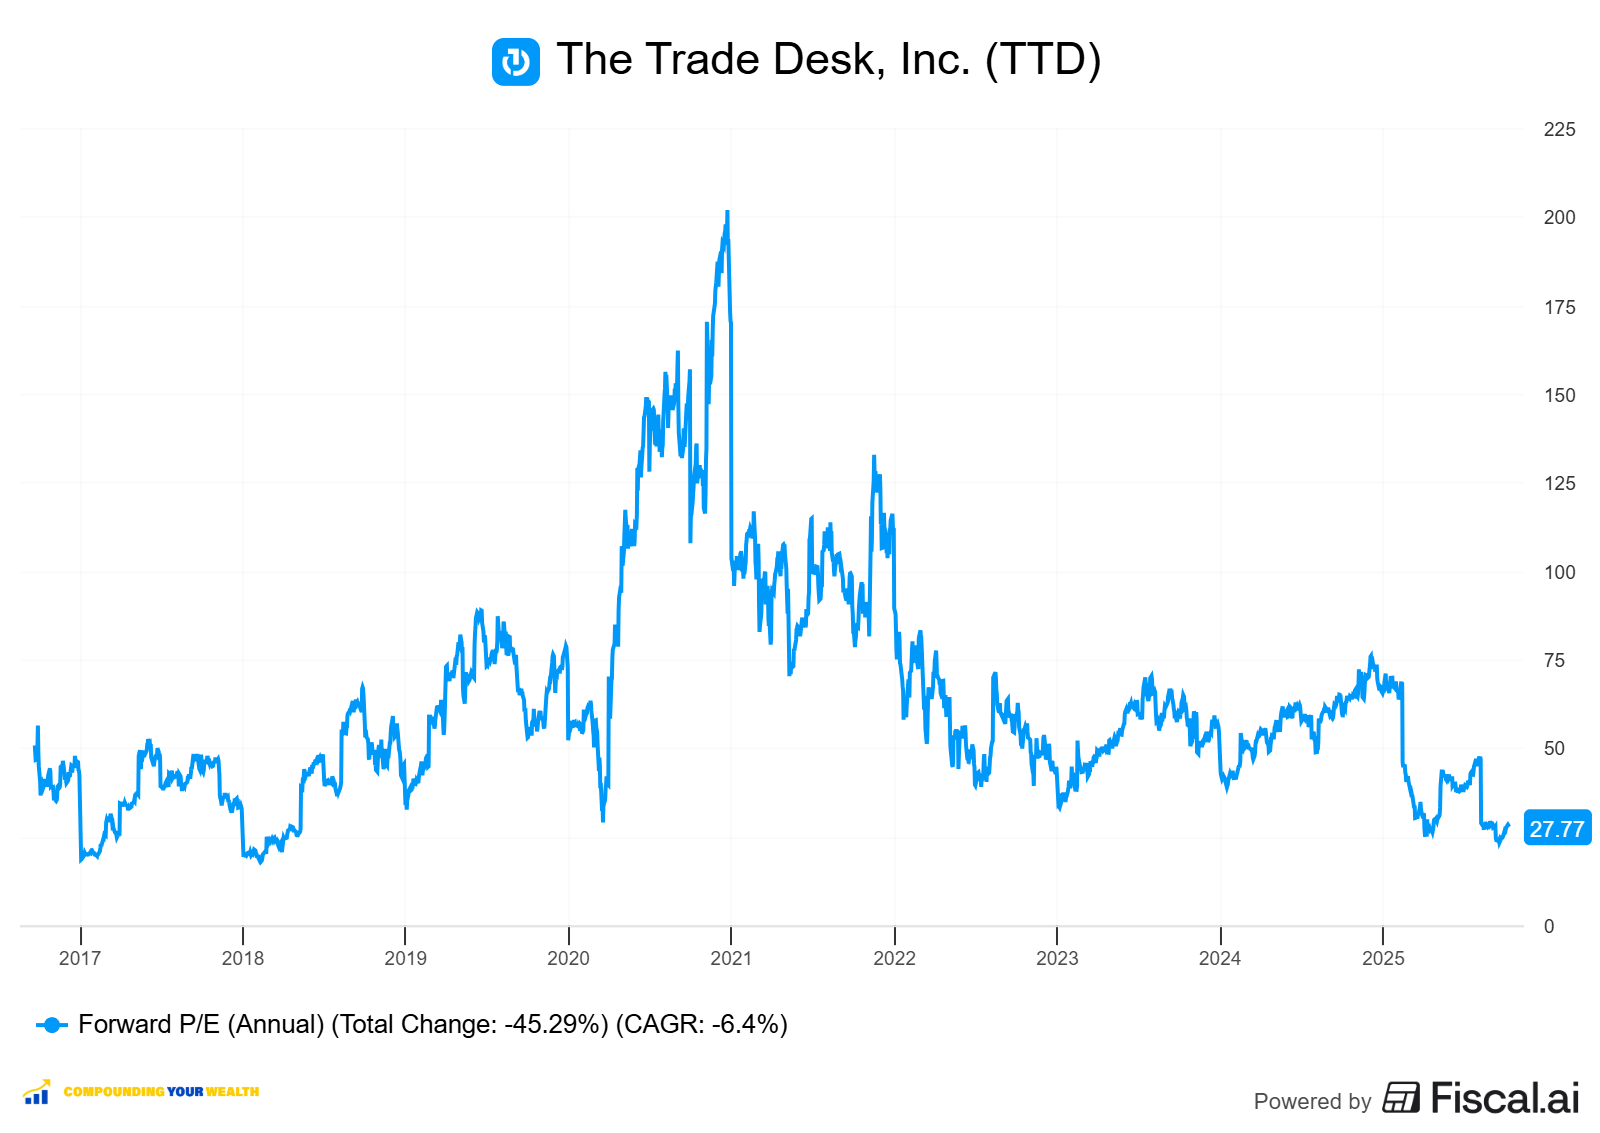
$TTD The Trade Desk is a GAAP net income profitable company. The Trade Desk trades at a forward P/E of 27.7, with revenue growth in the last quarter of 19% YoY. The forward P/E multiple is at historical lows. This forward P/E ratio is 1.4 times the anticipated revenue growth rate.
The EPS growth forecast for 2026 is 20.8%, with a P/E of 25.5 and a PEG ratio of 1.2.
The PEG (Price/Earnings to Growth) ratio is a key tool for evaluating growth stocks, introduced by Peter Lynch.
PEG < 1: Undervalued – A ratio below 1 suggests the stock is undervalued. For example, if the P/E is 15 and earnings are expected to grow by 20%, the PEG would be 0.75, indicating a good buying opportunity.
PEG = 1: Fair Value – A PEG of 1 means the stock price matches its growth expectations, representing fair value.
PEG > 1: Overvalued – A PEG above 1 indicates the stock may be overvalued, as its price is higher than its projected growth rate, making it riskier.
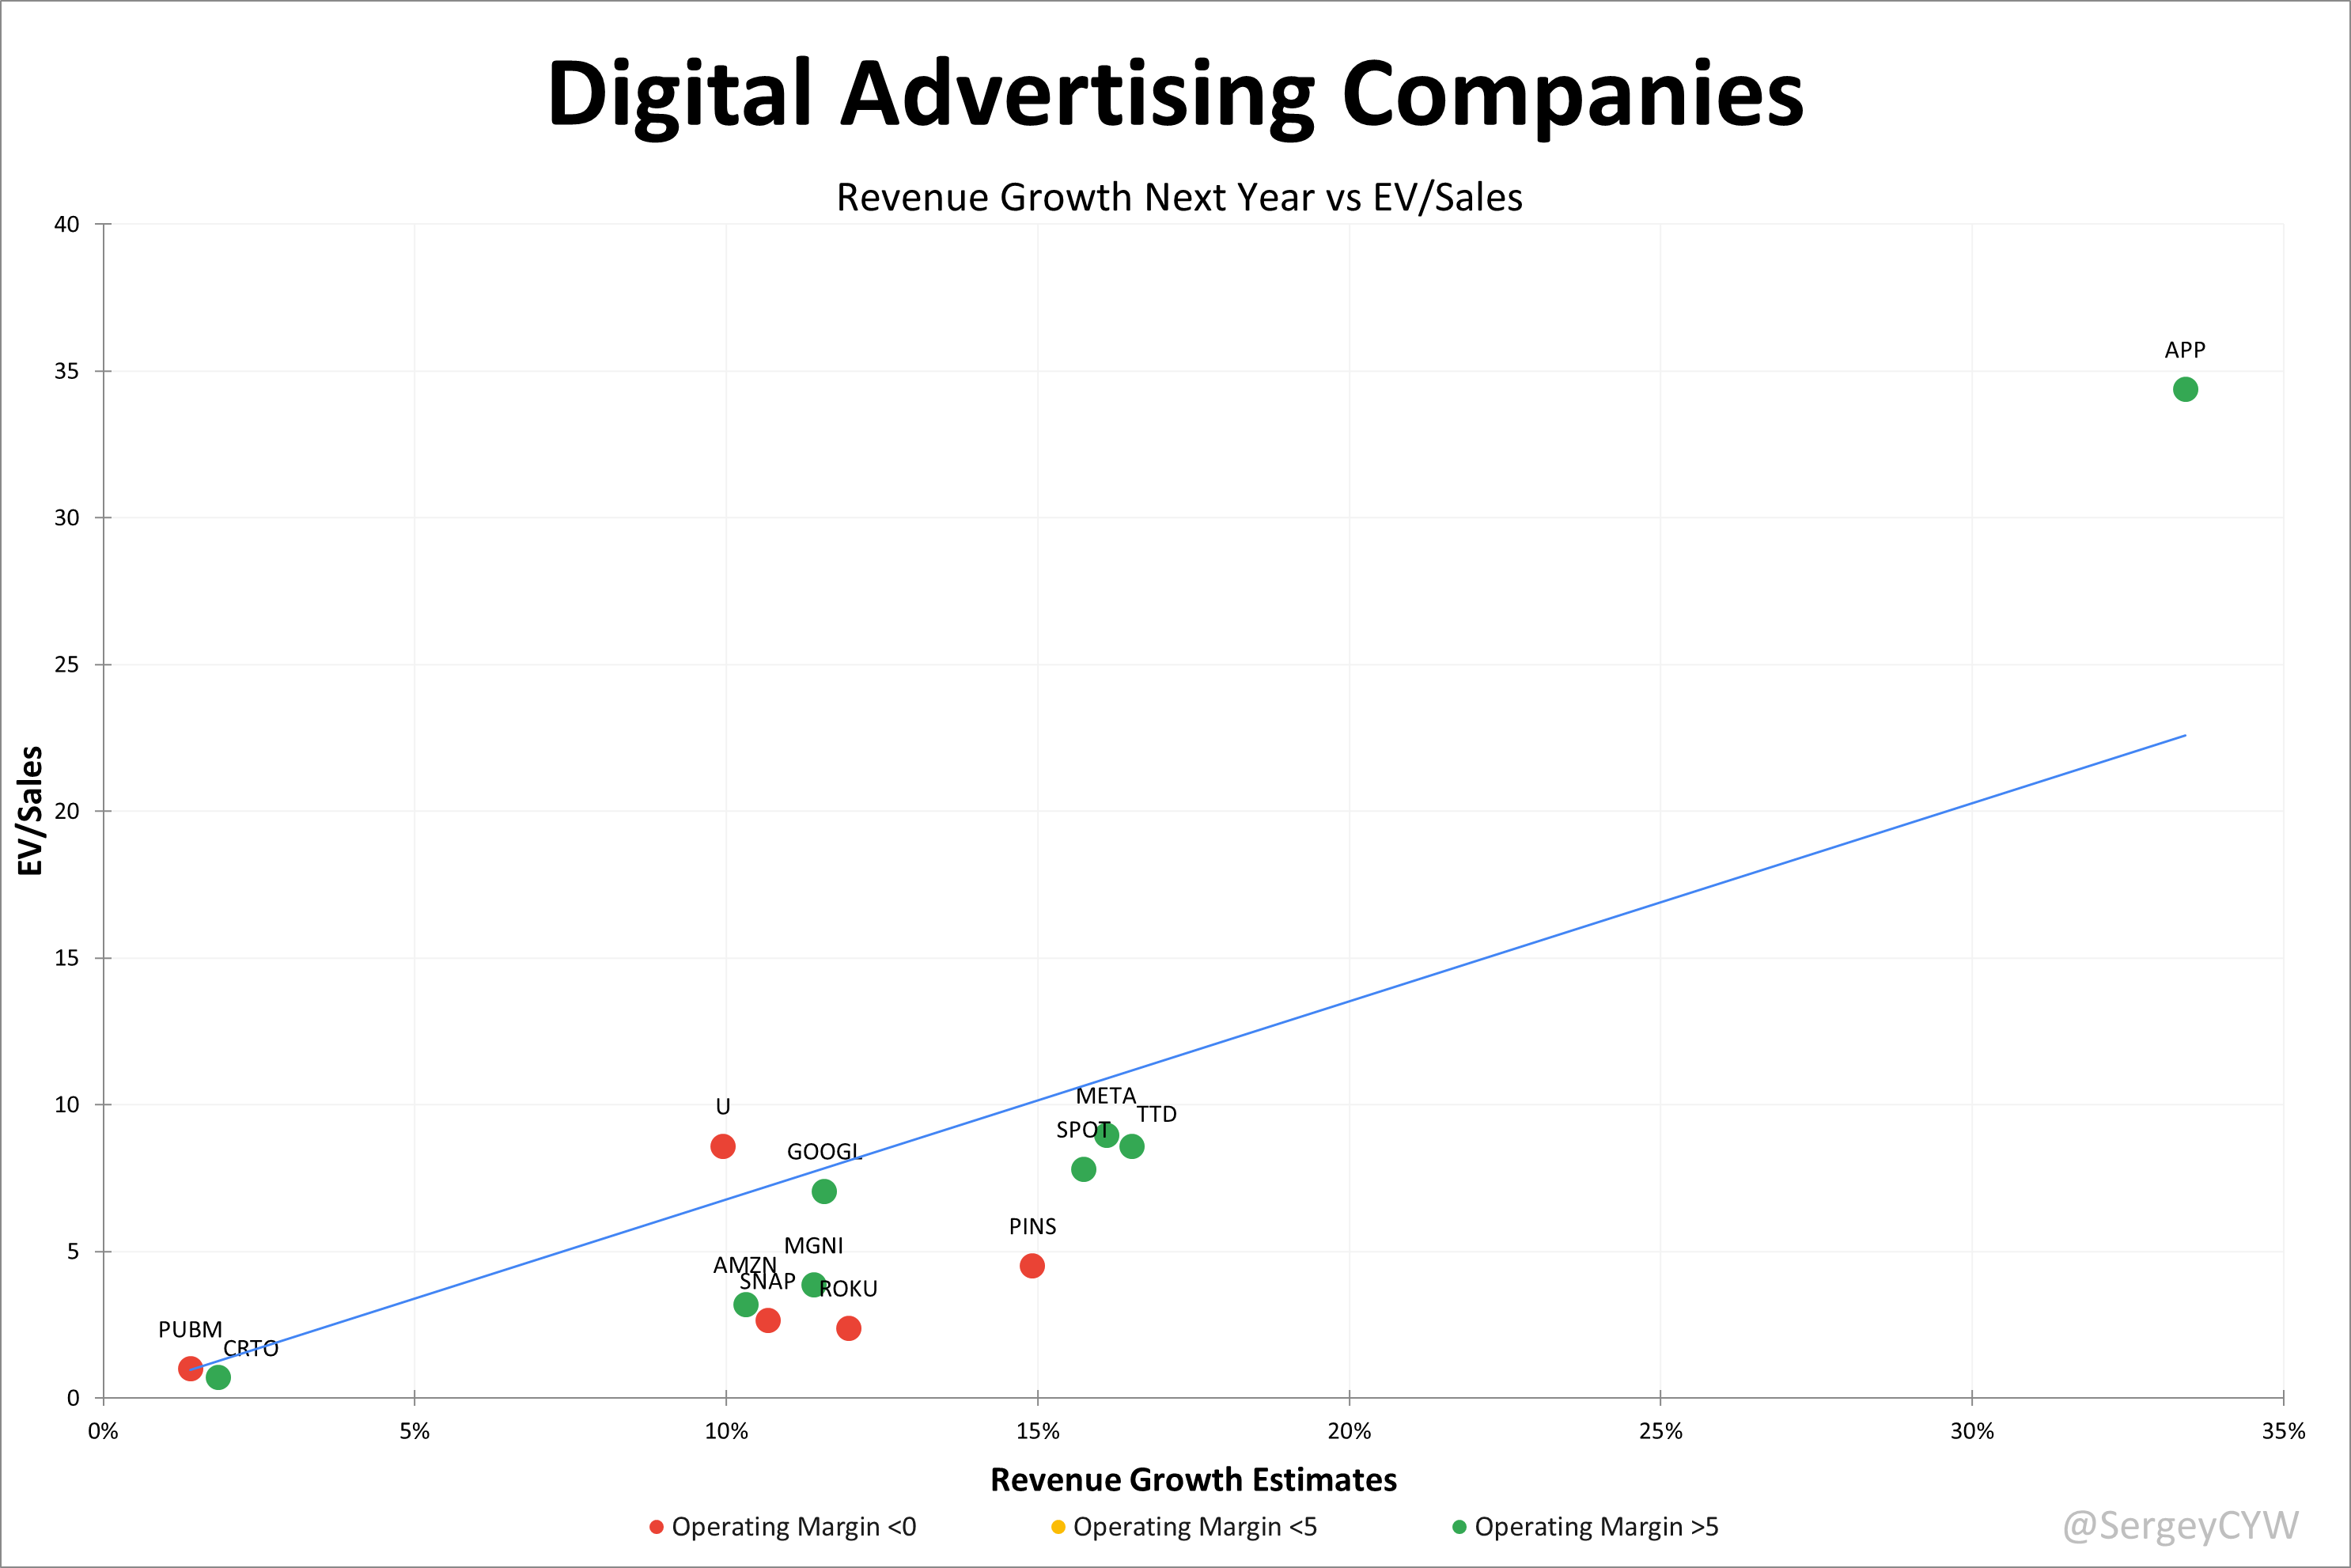
Valuation comparison
Analysts forecast $TTD’s revenue growth at +18.2% for 2025 and +16.5% for 2026. Based on these projections, The Trade Desk appears undervalued on an EV/Sales basis relative to other digital advertising companies. It’s also worth noting that analysts’ revenue growth forecast for The Trade Desk is among the highest in digital advertising, second only to $APP.
Analysts expect strong revenue growth, so let’s examine the key metrics to determine whether these expectations are justified.
We’ll evaluate the company’s economic moat, which supports long-term revenue growth, analyze revenue trends and the forecast for next quarter, and identify key factors that could help the company exceed expectations and sustain future growth.
We’ll assess the performance of key segments, the launch of new products and updates, customer acquisition growth, key financial metrics, financial stability, and margin trends.
Additionally, we’ll review the SBC/Revenue ratio, shareholder dilution, and finally, draw conclusions on the company’s outlook.
3. Economic Moat
The Trade Desk $TTD possesses a multifaceted economic moat built on five key defensive elements. The programmatic advertising leader demonstrates varying strengths across different moat categories, creating a comprehensive competitive advantage in the digital advertising ecosystem.
Economies of Scale
The Trade Desk processes over 13 million advertising impressions every second, creating powerful fixed cost leverage as infrastructure costs spread across billions of transactions. With $12 billion in annual platform spend, the company secures preferential rates from suppliers, passing savings to clients. Scale also strengthens AI performance through Kokai, where more data improves algorithms in a continuous feedback loop. R&D investment at roughly 20% of revenue supports innovation while margins remain healthy, a balance smaller competitors cannot sustain.
Network Effects
As advertisers increase, The Trade Desk gains richer data that improves campaign performance across the platform. Access to 350+ data providers and 220 inventory suppliers adds density and value. A 95%+ client retention rate shows switching costs are meaningful, supported by stronger predictive capabilities from massive datasets. Yet, rivals like Google DV360 and Amazon DSP maintain closed ecosystems, limiting universal network effects.
Brand Strength
The Trade Desk builds brand equity on transparency and independence. Its platform earns a 4.6-star Gartner rating versus Amazon DSP’s 4.4. Reliability is a core strength, with practitioners noting the absence of major breakdowns. Transparent fees of 10–20% of ad spend create trust, though they also invite price comparisons. Maintaining strong agency relationships remains critical as the company moves closer to direct advertiser deals.
Intellectual Property
Proprietary bidding algorithms and Kokai’s distributed AI provide differentiation. The system supports billions of bid permutations with only a few clicks. Yet competitive threats are constant as Google and Amazon expand their capabilities. Shareholder lawsuits over AI disclosures reveal IP vulnerabilities, while commoditization of programmatic technology limits long-term defensibility despite heavy R&D spend.
Switching Costs
Agencies invest time and training into mastering The Trade Desk’s platform, making transitions costly. Consolidated billing across providers and accumulated campaign data create operational and intellectual property frictions. Master Service Agreements further discourage churn. Still, switching costs are lower than fully managed services, and sophisticated agencies often run campaigns across multiple DSPs, reducing dependence on a single platform.
The Trade Desk holds a strong competitive moat built on economies of scale, a very strong network effect, and high switching costs. Its $694M Q2 2025 revenue and 95% retention rate reflect operational scale and customer loyalty. As the leading independent DSP, it benefits from a self-reinforcing ecosystem across the open internet, especially in CTV. The Kokai platform and UID2 strengthen its IP position, though rapid tech shifts demand constant innovation. Deep platform integration and mission-critical performance create substantial frictionfor clients to switch.
4. Revenue growth
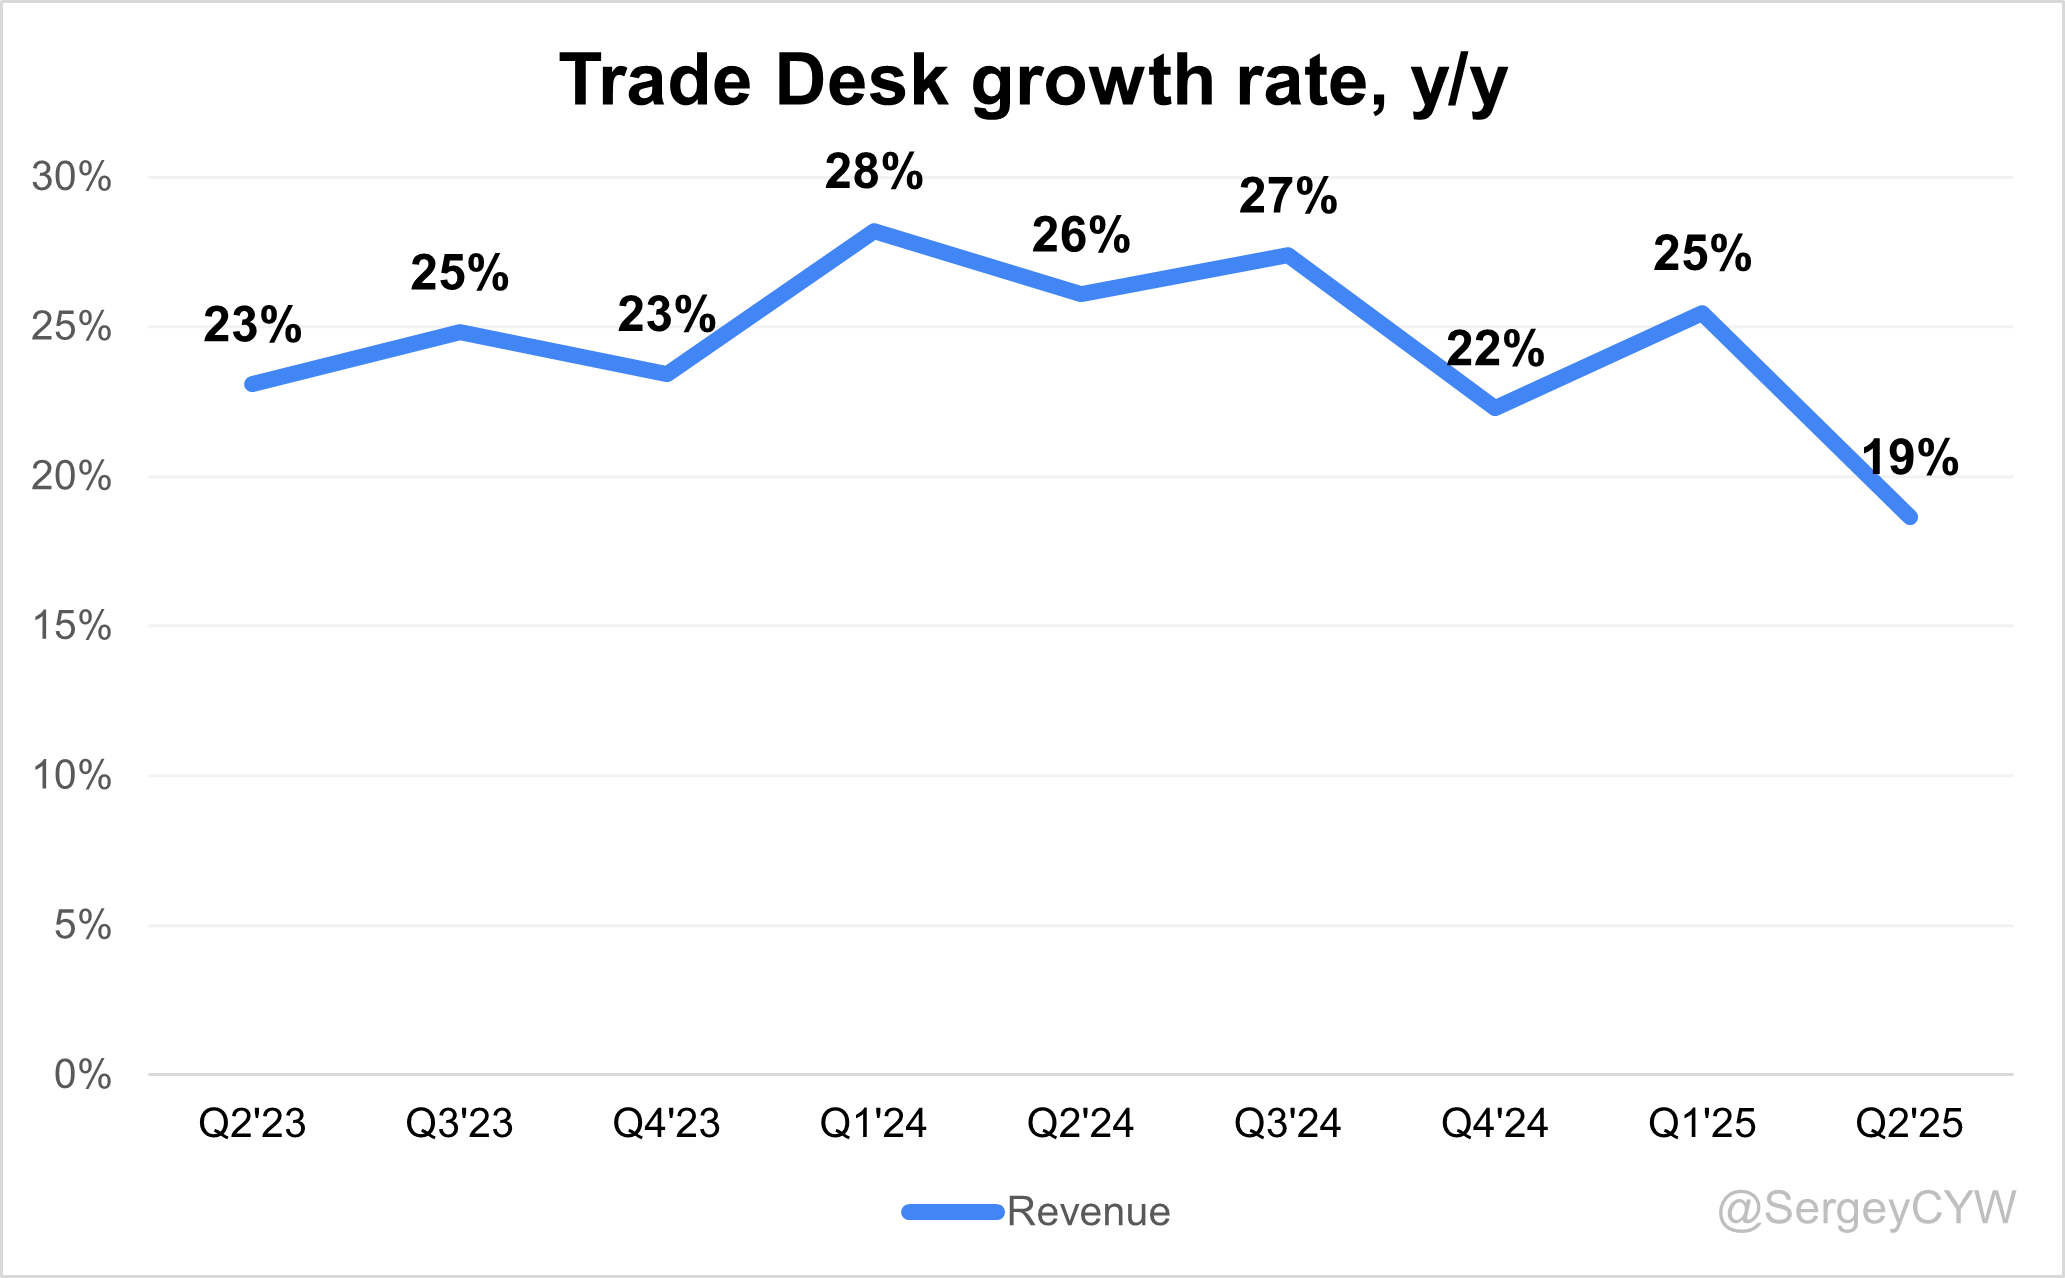
$TTD’s revenue growth slowed significantly from +25.5% YoY last quarter to +18.6% in Q2 2025. The revenue beat in Q2 was only 1.8%. If the company beats its forecast by 1.8% again, Q3 growth would be just 16.2%, indicating further deceleration in revenue growth.
5. Segments and Main Products
The Trade Desk operates as a global demand-side platform (DSP), serving as core infrastructure for data-driven digital advertising across multiple channels. Its Kokai platform, now used by two-thirds of clients, integrates AI to enhance targeting, improve performance, and lower acquisition costs.
Within Kokai, Deal Desk streamlines programmatic transactions by offering automation tools, quality scoring, and detailed inventory insights. The company also holds a strong position in Connected TV (CTV) through partnerships with Disney and Comcast, while developing Ventura, its own smart TV operating system.
OpenPath connects advertisers directly with publishers, bypassing traditional supply-side platforms, while Unified ID 2.0 (UID2) provides a cookieless identity solution for targeting in a post-cookie world. In retail media, The Trade Desk partners with major retailers like Instacart to integrate first-party retail data for audience targeting.
For enterprise clients, the company offers APIs that allow customized bidding platforms and advanced programmatic strategies, supporting flexibility and competitive differentiation.
Main Products Performance in the Last Quarter
Connected TV (CTV)
Fastest-growing channel with momentum from Disney, NBCU, Walmart, Roku, LG, Netflix. Advertisers favored upfront flexibility over full-year commitments, tilting spend to biddable CTV. Live sports tooling arrives via Kokai plus partnerships with Disney, Sky, Omnicom—moment-based buying such as NBA overtime and soccer PKs. Result: sustained mix shift to decisioned CTV and premium open internet.
Kokai
Largest platform upgrade in company history. ~75% of client spend already routed through Kokai; full client usage expected by year-end. Performance lift >20 points on key KPIs. Samsung delivered +43% target reach in Europe; Cashrewards saw -73% CPA in Asia. Clients moving majority of spend to Kokai are increasing overall TTD spend >20% faster than others. Under the hood: forecasting, campaign optimization, supply-path optimization, predictive clearing, plus “distributed AI” and always-on agentic workflows.
Deal Desk
In beta; AI-driven forecasting for deal pacing, delivery, and performance. Surfaces open-market or premium alternatives to rescue under-performers. Early publisher adopter: Disney. Objective is fewer broken deals, more efficient delivery across buyers, publishers, and SSPs.
OpenPath
Direct publisher integration to improve transparency and price discovery. Meaningful portion of spend now flows via OpenPath. Impact: New York Post programmatic display revenue +97%; Hearst Newspapers fill rate 4x. Strategic aim: cleaner, cheaper supply paths without moving into SSP yield management.
UID2
Anchor identity for objective buying and measurement across open internet. Messaging to brands: avoid walled-garden “grade your own homework” constraints. UID2 underpins cross-retailer measurement and outcome attribution as retail data scales.
Retail Media Solutions
Record spend influenced by retail data on TTD and Walmart DSP. Partnerships expanded with Instacart and Ocado for SKU-level purchase signals. Shopper-marketing budgets accelerate into programmatic; outcome-based optimization strengthens ROI narrative.
Enterprise APIs
Focus on interoperability via retail data pipes, measurement endpoints, and supply-chain metadata (Sincera) embedded across bidding and forecasting. Emphasis on objective, auditable outcomes for large brands and agencies.
Sincera & OpenSincera
Sincera supply-quality metadata now a core signal in valuation and supply-path selection. OpenSincera launched with free visibility into ad quality across thousands of publishers, prompting publisher clean-ups soon after launch.
Joint Business Plans (JBPs)
Live JBPs at an all-time high; nearly 100 in pipeline, many late-stage. Spend under JBPs is growing significantly faster than overall platform spend. Many JBPs signed directly with brands while activating hand-in-hand with agencies.
Innovation & Product Updates
Kokai feature velocity accelerating: AI forecasting, agentic monitoring, supply-path selection, predictive clearing, and live-sports moment buying. Deal Desk rolling out to normalize deal outcomes using AI. Sincera signals fused into bidding. Retail integrations broadened for outcome measurement. Goal: database decisioning over mere access, with premium open internet—TV, movies, music, journalism, sports—at the core.
Leadership Transition
CFO transition to Alex Kayyal on Aug 21; outgoing CFO Laura Schenkein stays through year-end. Board adding Omar Tawakol.
6. Market Leadership
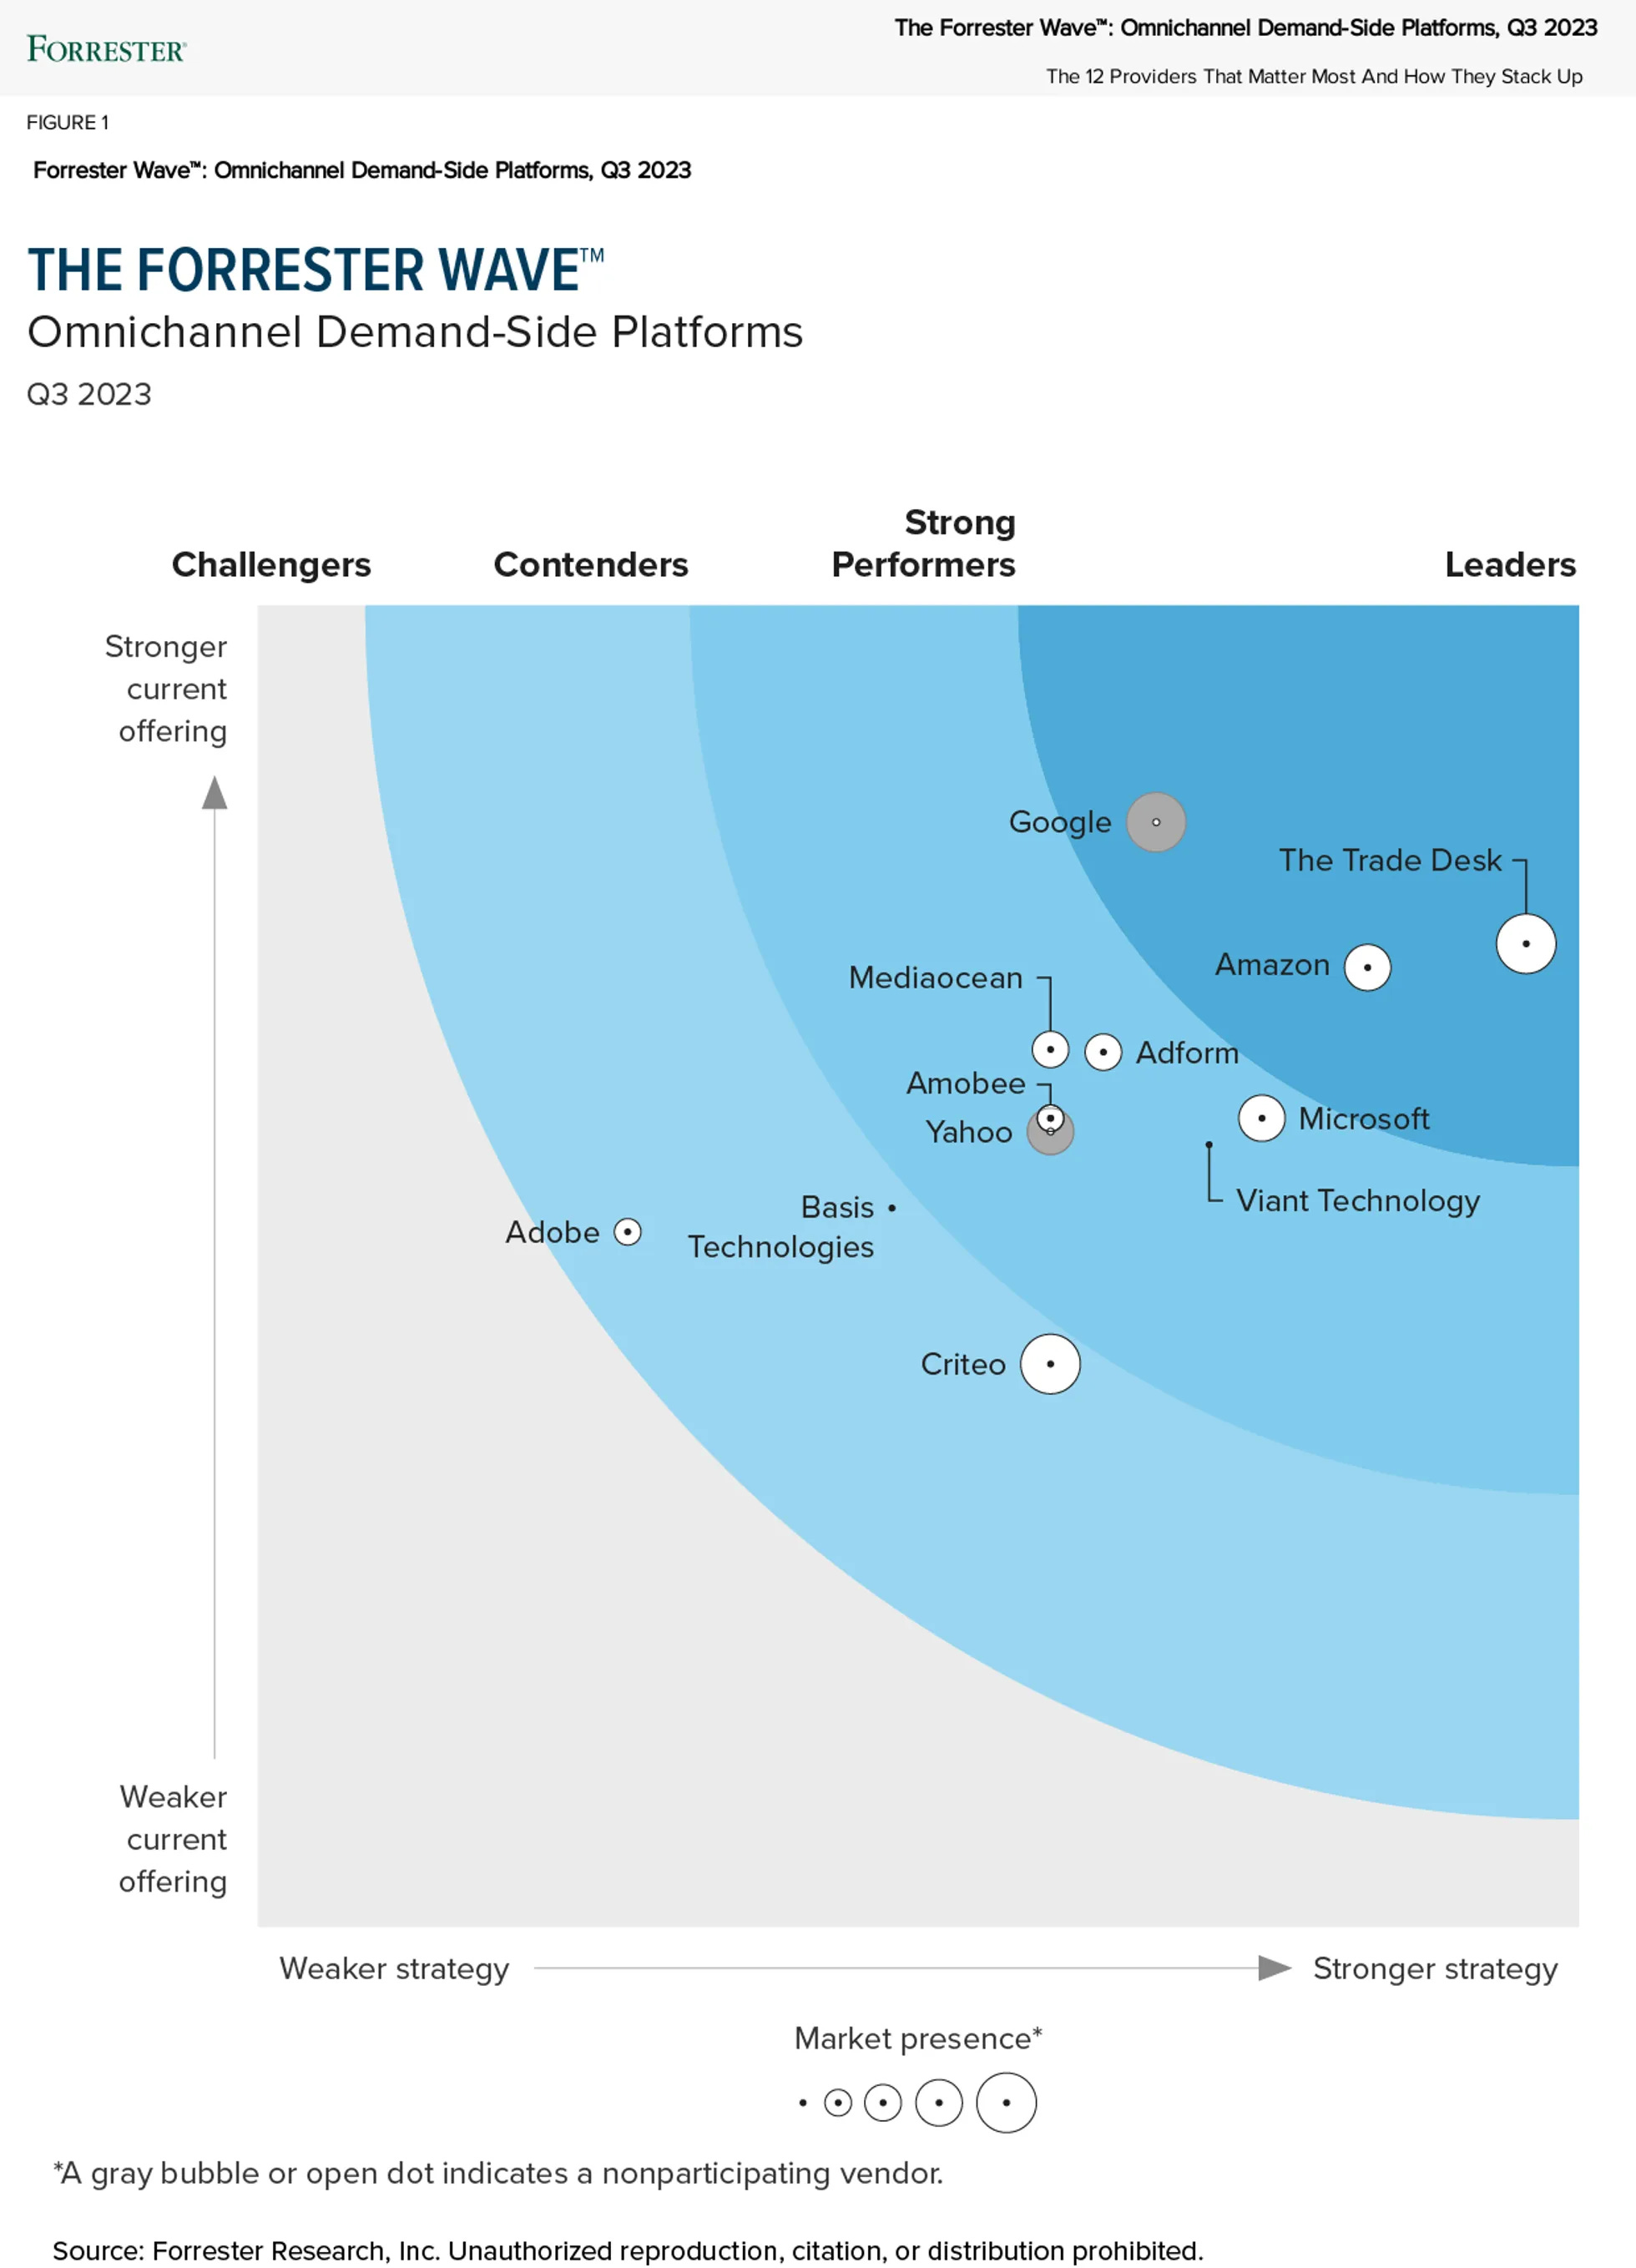
The Trade Desk secured the top position in The Forrester Wave: Omnichannel Demand-Side Platforms, Q3 2023, earning the highest score in the strategy category. Forrester evaluated 12 top vendors across 28 criteria and awarded The Trade Desk top marks for vision and innovation. The firm noted, “The Trade Desk leads with usability and prescient bets on CTV and Identity.”
Forrester emphasized The Trade Desk’s leadership in Connected TV, calling it “the dominant DSP for CTV.” Strategic integrations with Disney and AMC enable first-party data activation via Unified ID 2.0, while its CTV quality metric enhances brand reach measurement. Clients praised the platform’s intuitive UI and transparent reporting.
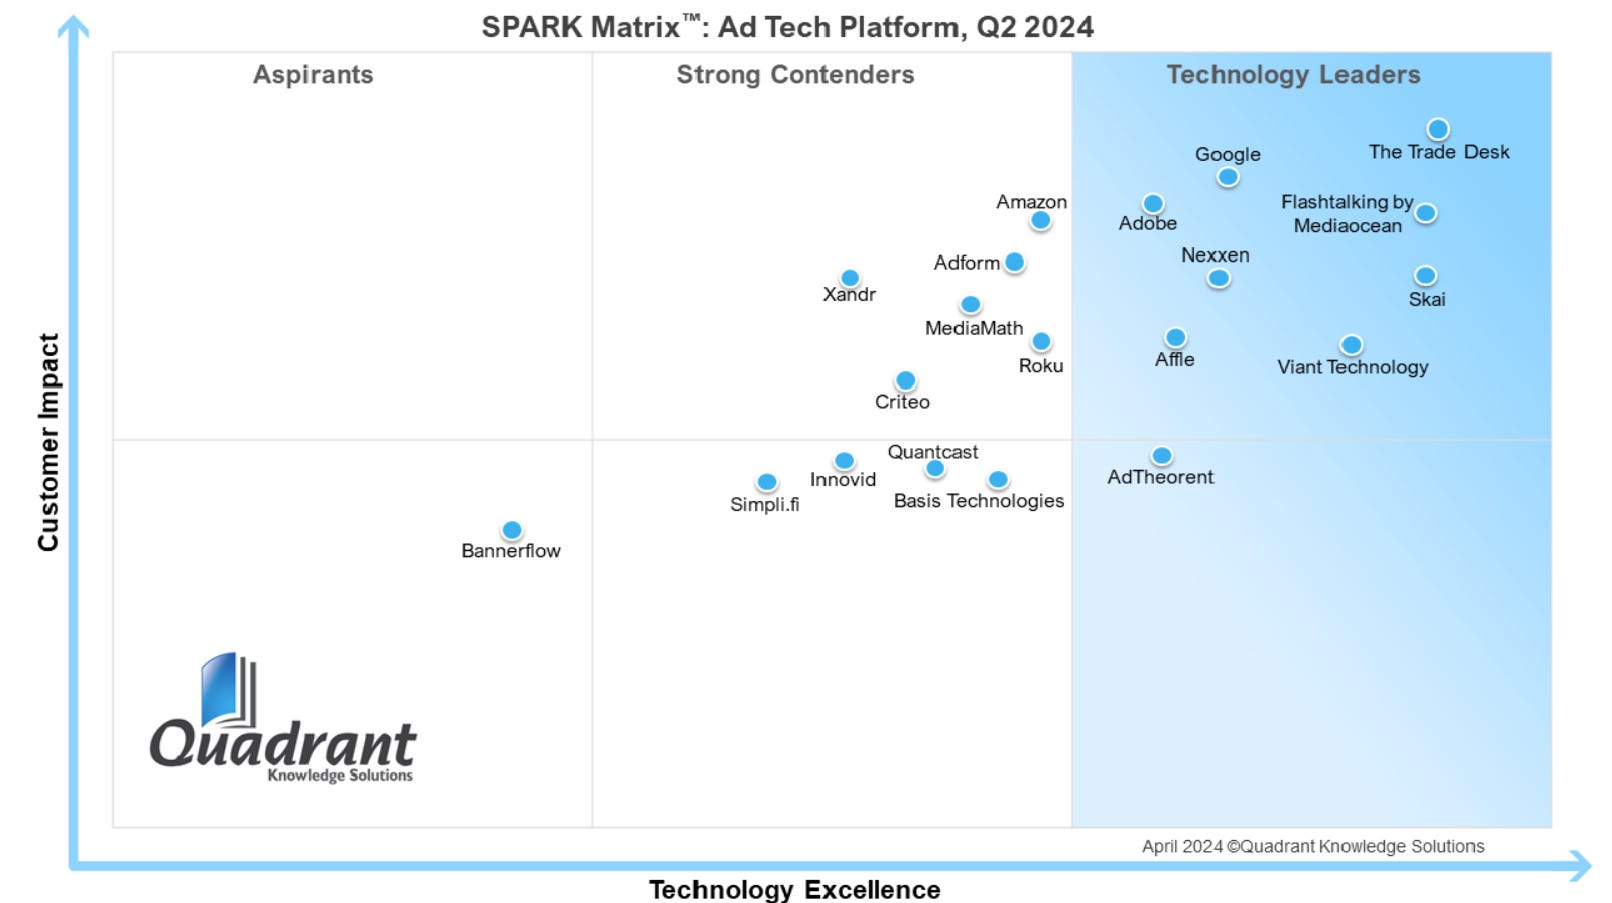
In 2024, The Trade Desk was also named a leader in the Quadrant Knowledge Solutions SPARK Matrix for Ad Tech, ranking highest in both technology excellence and customer impact. The evaluation covered 20 AdTech companies, positioning The Trade Desk alongside top-tier players such as Adobe, Google, and Flashtalking.
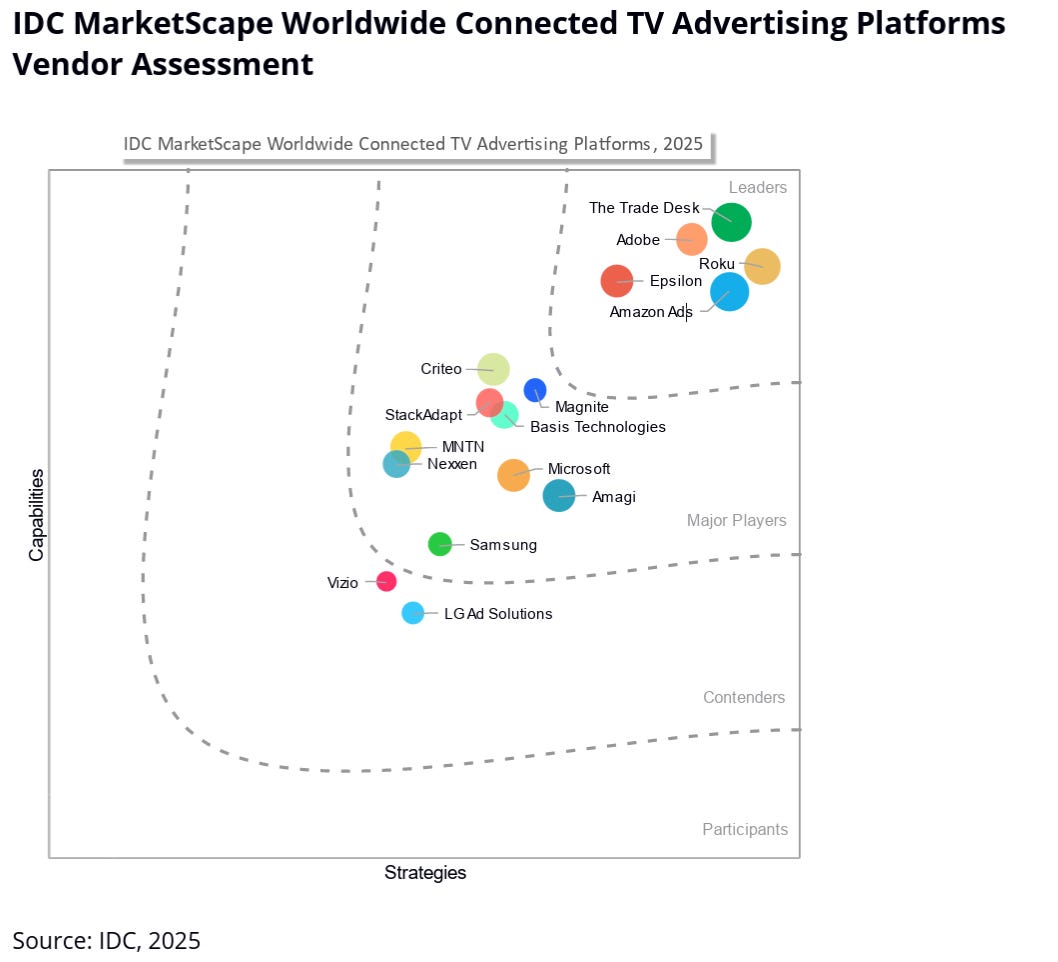
IDC positioned The Trade Desk in the Leaders category in its 2025 IDC MarketScape: Worldwide Connected TV Advertising Platforms Vendor Assessment. The company earned the highest score in Capabilities among all evaluated vendors, demonstrating technical superiority in the CTV advertising space.
IDC highlighted TTD’s advanced targeting capabilities enabling advertisers to reach highly specific audience segments, supported by real-time bidding and data-driven optimization tools. The analysis recognized the platform’s transparency providing advertisers with control over data and campaign execution, while noting its open platform architecture integrating seamlessly with other marketing technologies through extensive APIs and partnerships.
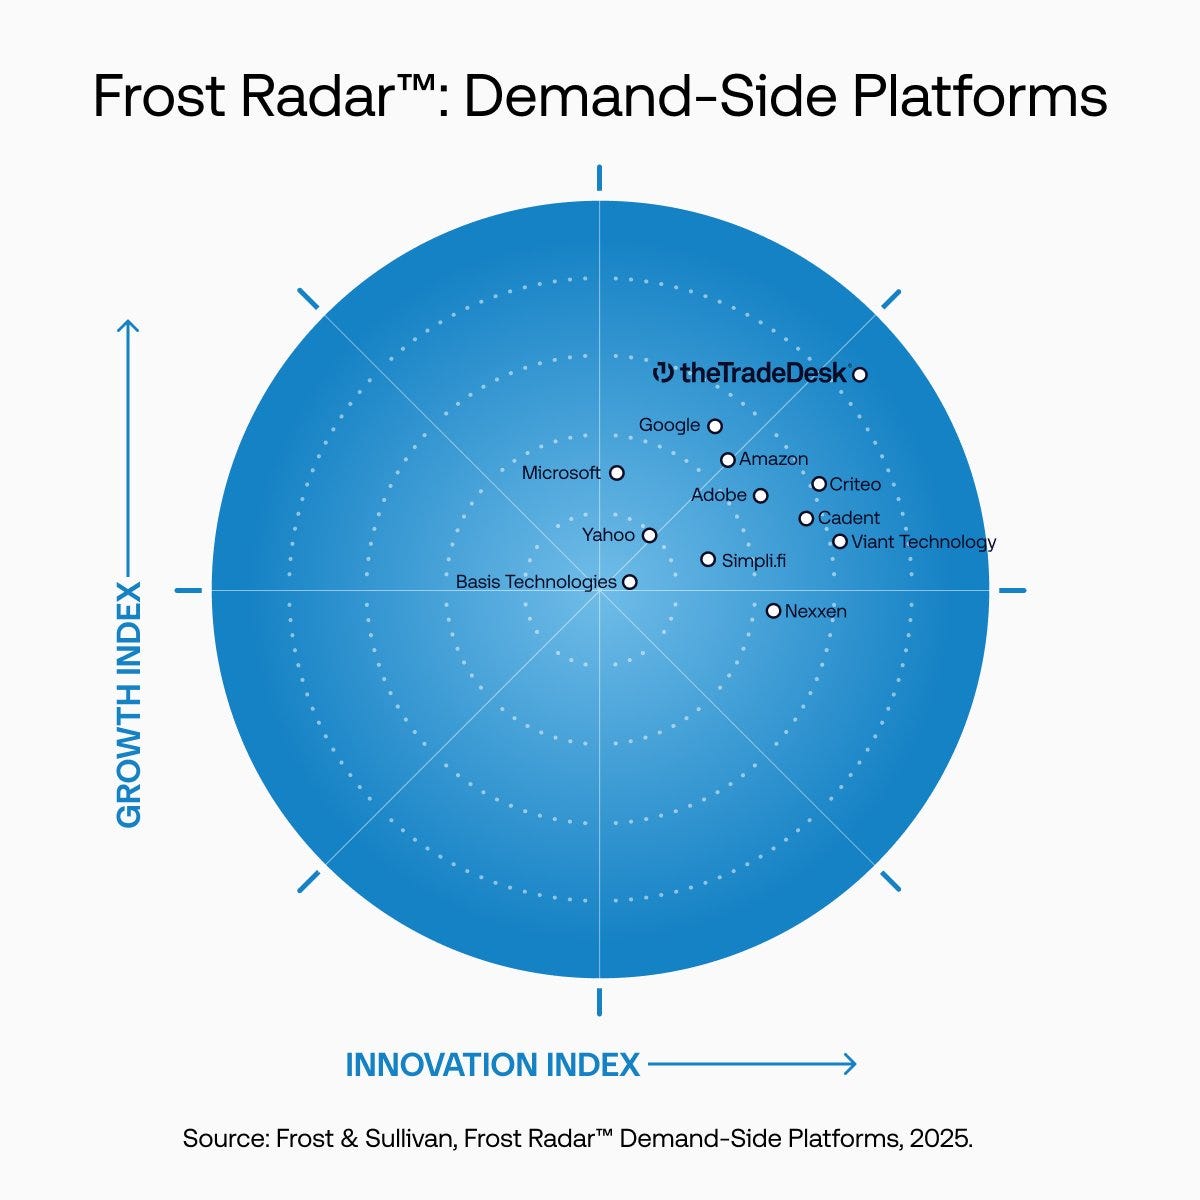
The Trade Desk recognized as a leading vendor in 2025 Frost Radar for Demand-Side Platforms for the second consecutive time, emerging as the Innovation and Growth leader, scoring 5 out of 5 on the Innovation Index and 4.80 out of 5 on the Growth Index.
7. Customers
Customer Success Stories
Samsung lifted target-audience reach +43% on an omnichannel European campaign after moving to Kokai. Cashrewards cut CPA -73% in Asia using Kokai optimization. The New York Post increased programmatic display revenue +97% via OpenPath. Hearst Newspapers achieved a 4x improvement in fill rate post-OpenPath integration. Performance gains on Kokai exceed 20 points across core KPIs, and clients shifting most spend to Kokai are growing total platform spend >20% faster than peers.
Large Customer Wins
Signed multiyear joint business plans with leading brands at a record pace; active JBPs sit at an all-time high with ~100 in pipeline. Spend under JBPs is accelerating significantly faster than overall platform spend. Enterprise adoption is deep across CTV, retail media, identity, and measurement, with large advertisers prioritizing biddable CTV flexibility in the upfronts, directing incremental share toward the open internet.
Strategic Partnerships
CTV momentum reinforced by Disney, NBCU, Walmart, Roku, LG, and Netflix. Live-sports moment buying launches through Kokai with Disney, Sky TV, and Omnicom, enabling precision activation at high-engagement moments. Retail media measurement expands via Instacart and Ocado, adding granular purchase signals. Supply-chain transparency advances as News Corp’s New York Post and Hearst Newspapers scale on OpenPath. Outcome measurement anchored in UID2 with hundreds of retailers. Walmart DSP collaboration continues to channel shopper budgets into programmatic.
International Expansion
International mix at 14% of spend with growth ahead of North America, led by CTV adoption. Kokai case studies span regions: Samsung in Europe and Cashrewards in Asia. Retail data and identity integrations extend globally, supporting outcome-based buying across markets and reinforcing the company’s expansion playbook outside the U.S.
8. KPI
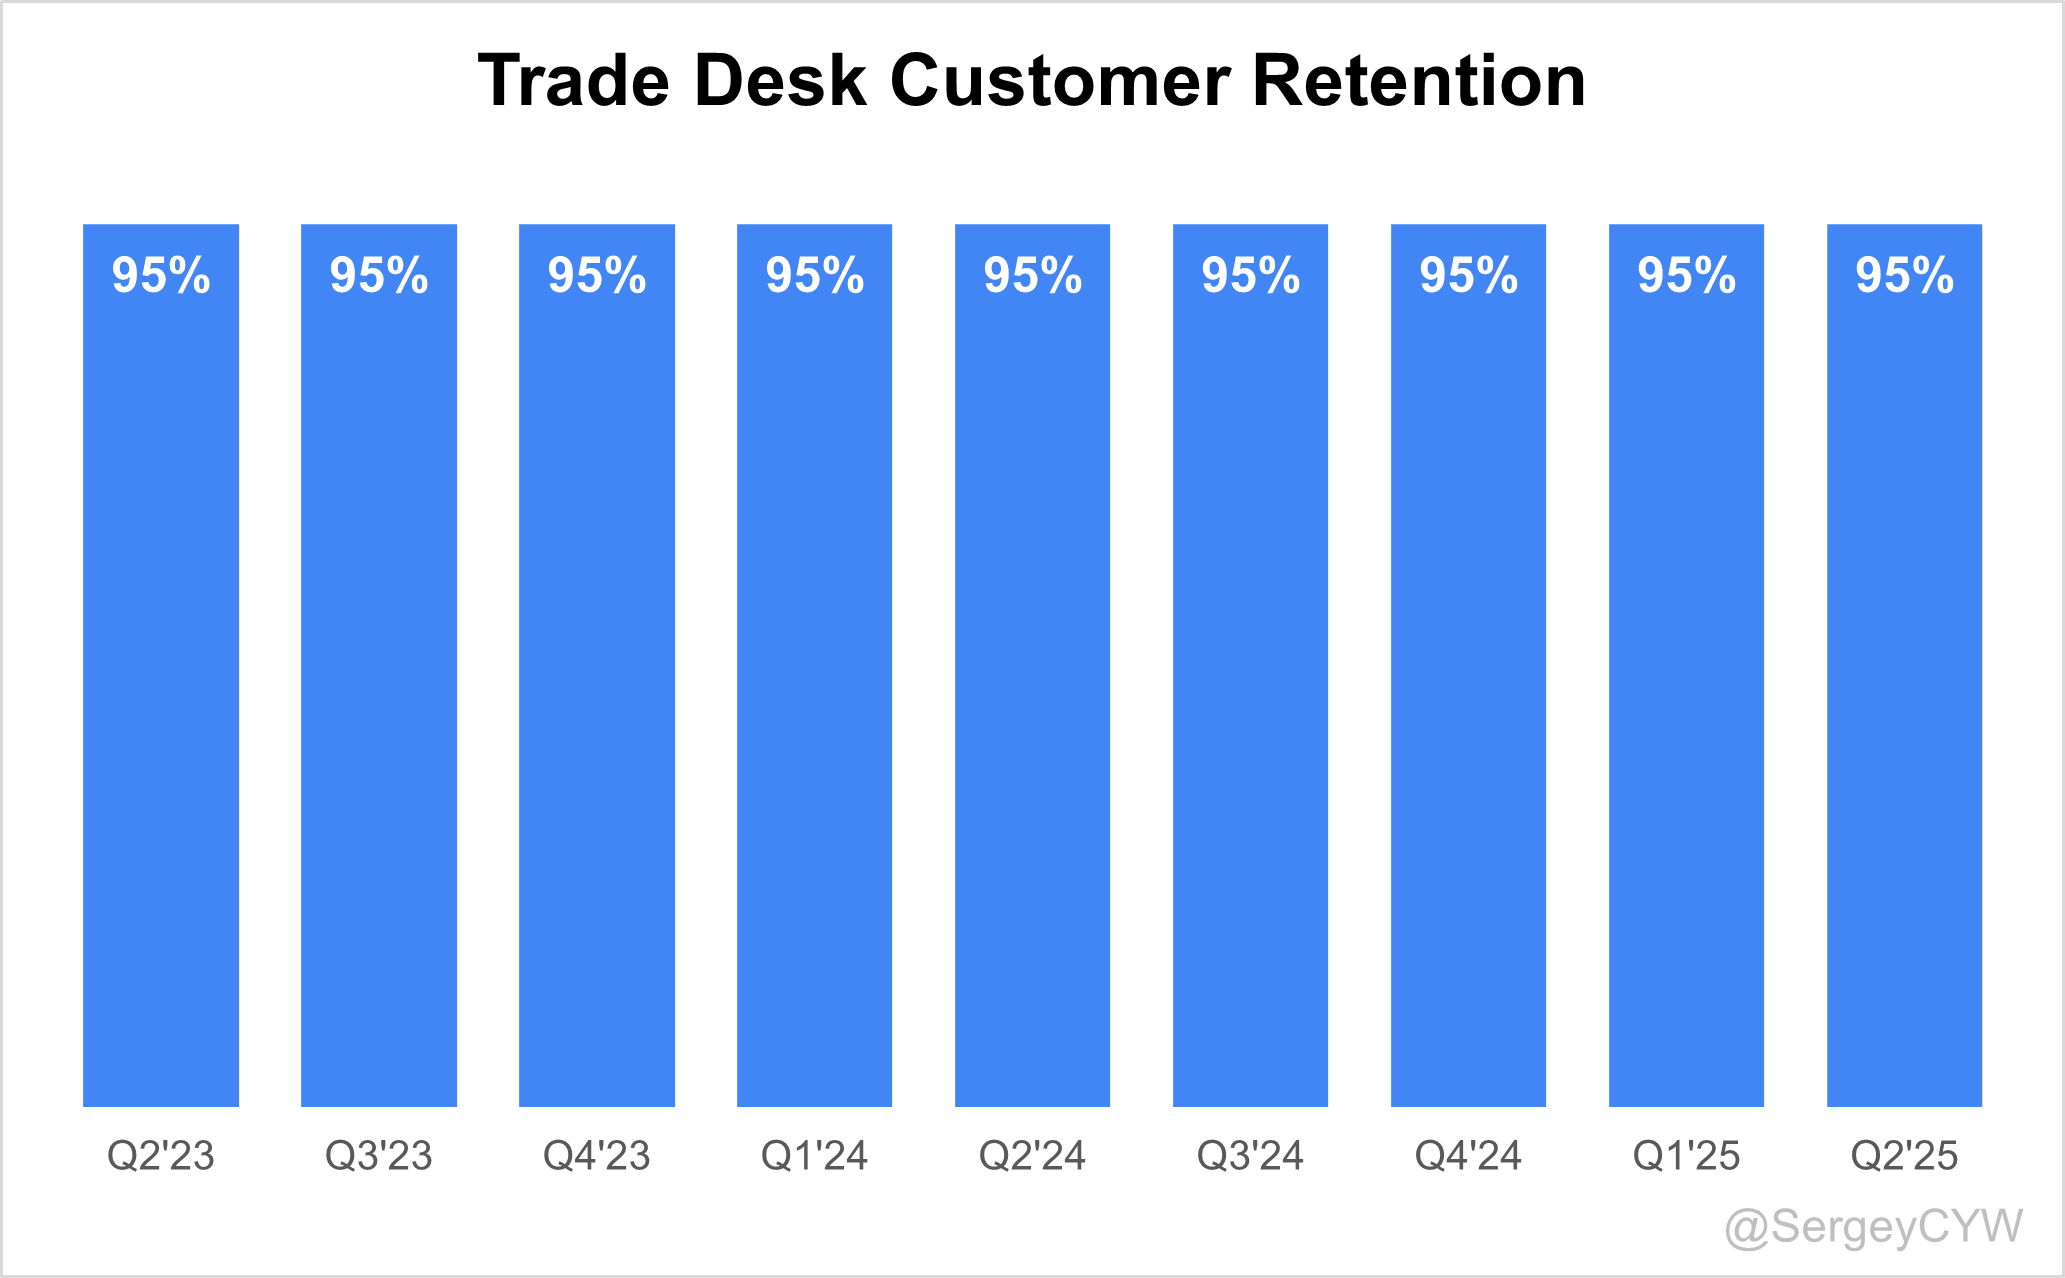
Retention
$TTD’s Customer Retention Rate has remained high for a long time, consistently above 95%.
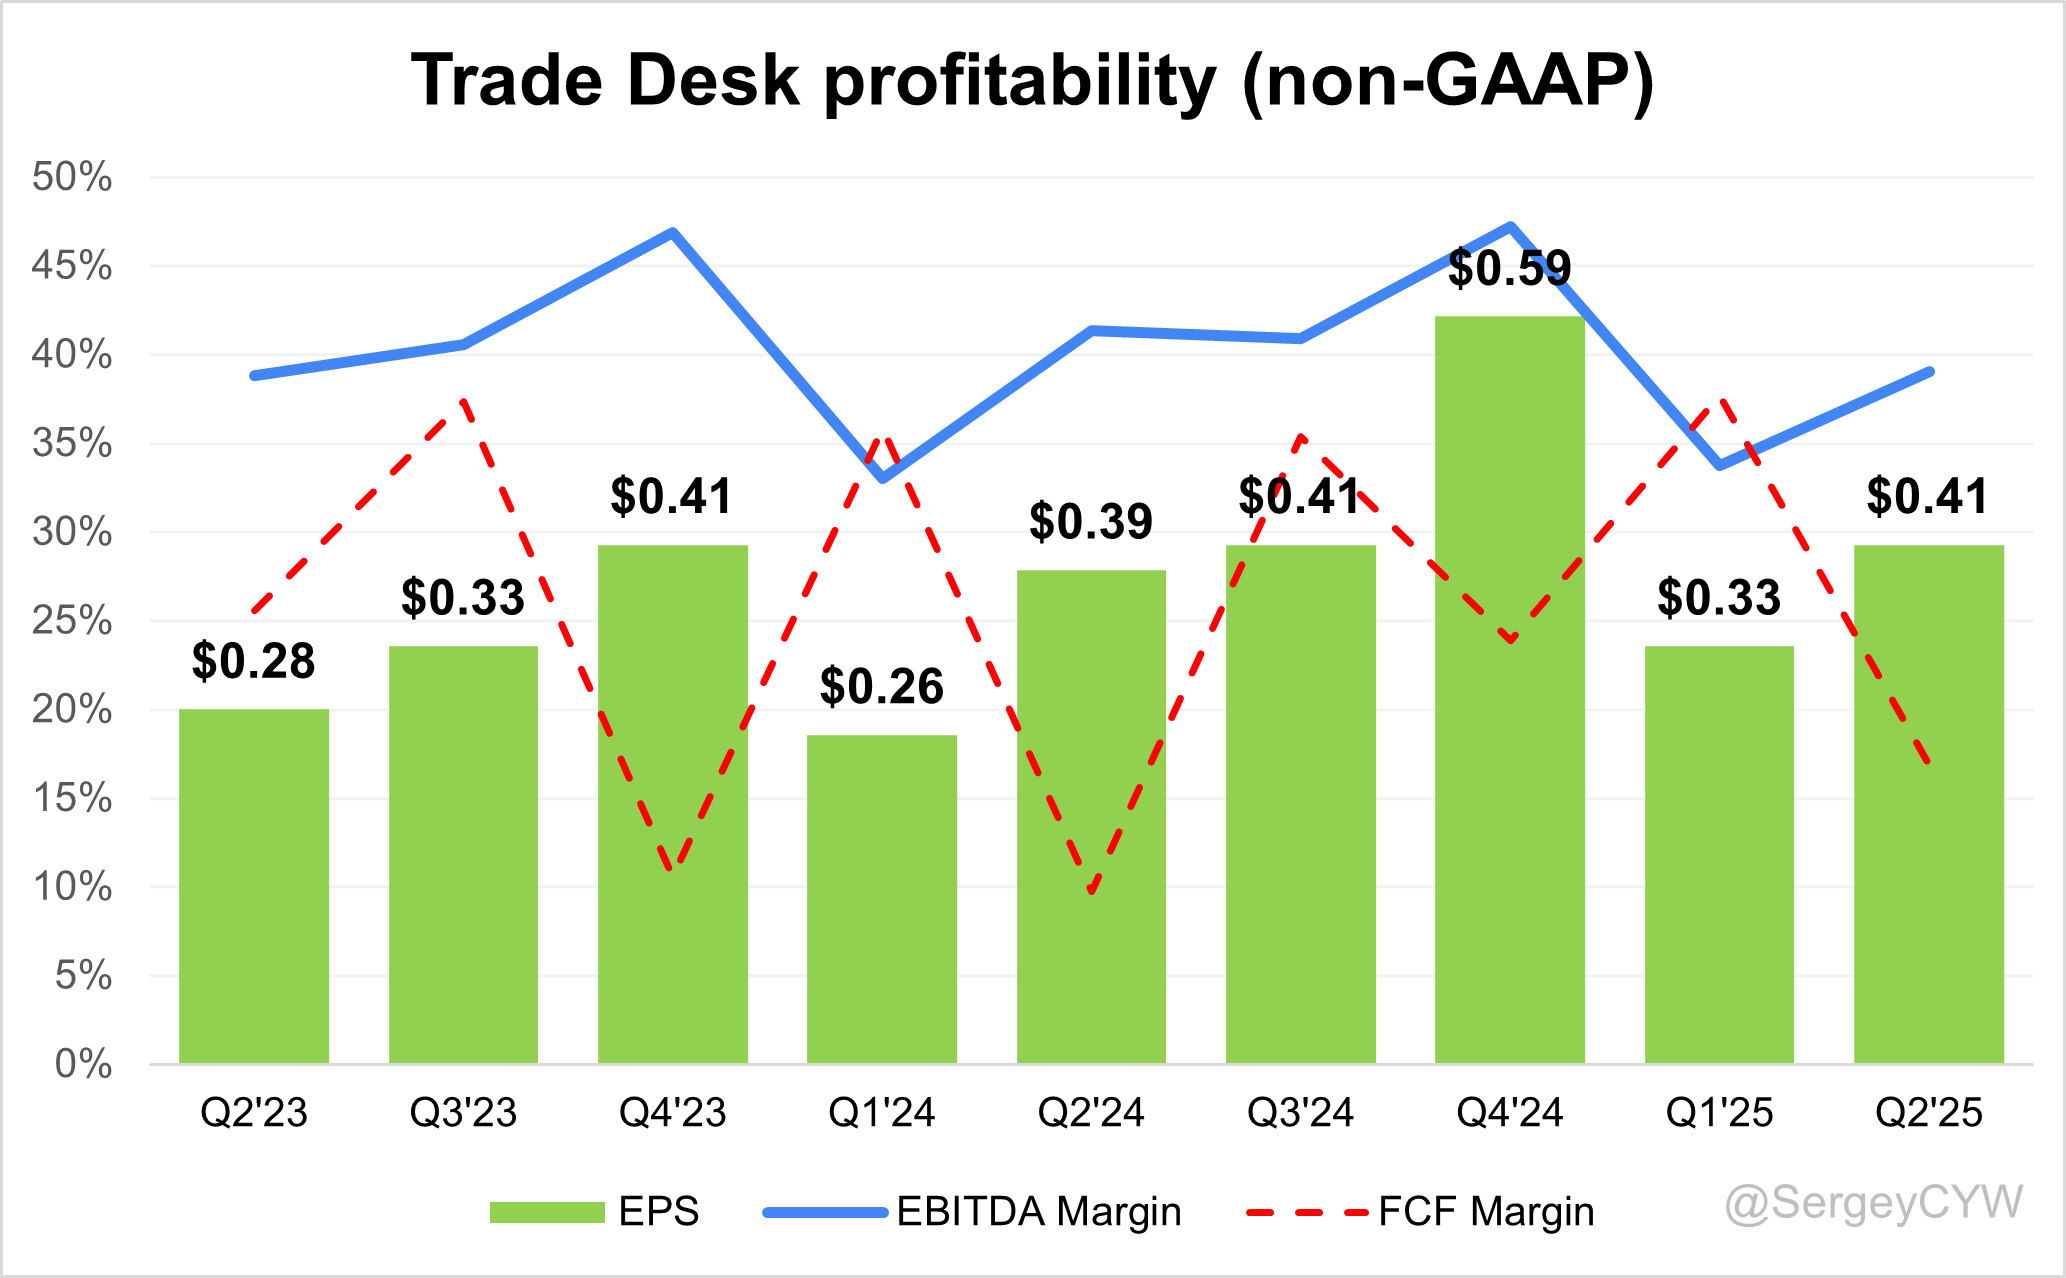
Profitability
Over the past year, $TTD has seen changes in its margins and profitability:
· EBITDA margin decrease from 41.4% to 31.0%.
· Net margin GAAP decrease slightly from 33.7% to 29.2%.
· FCF margin rose from 9,7% to 16,8%.
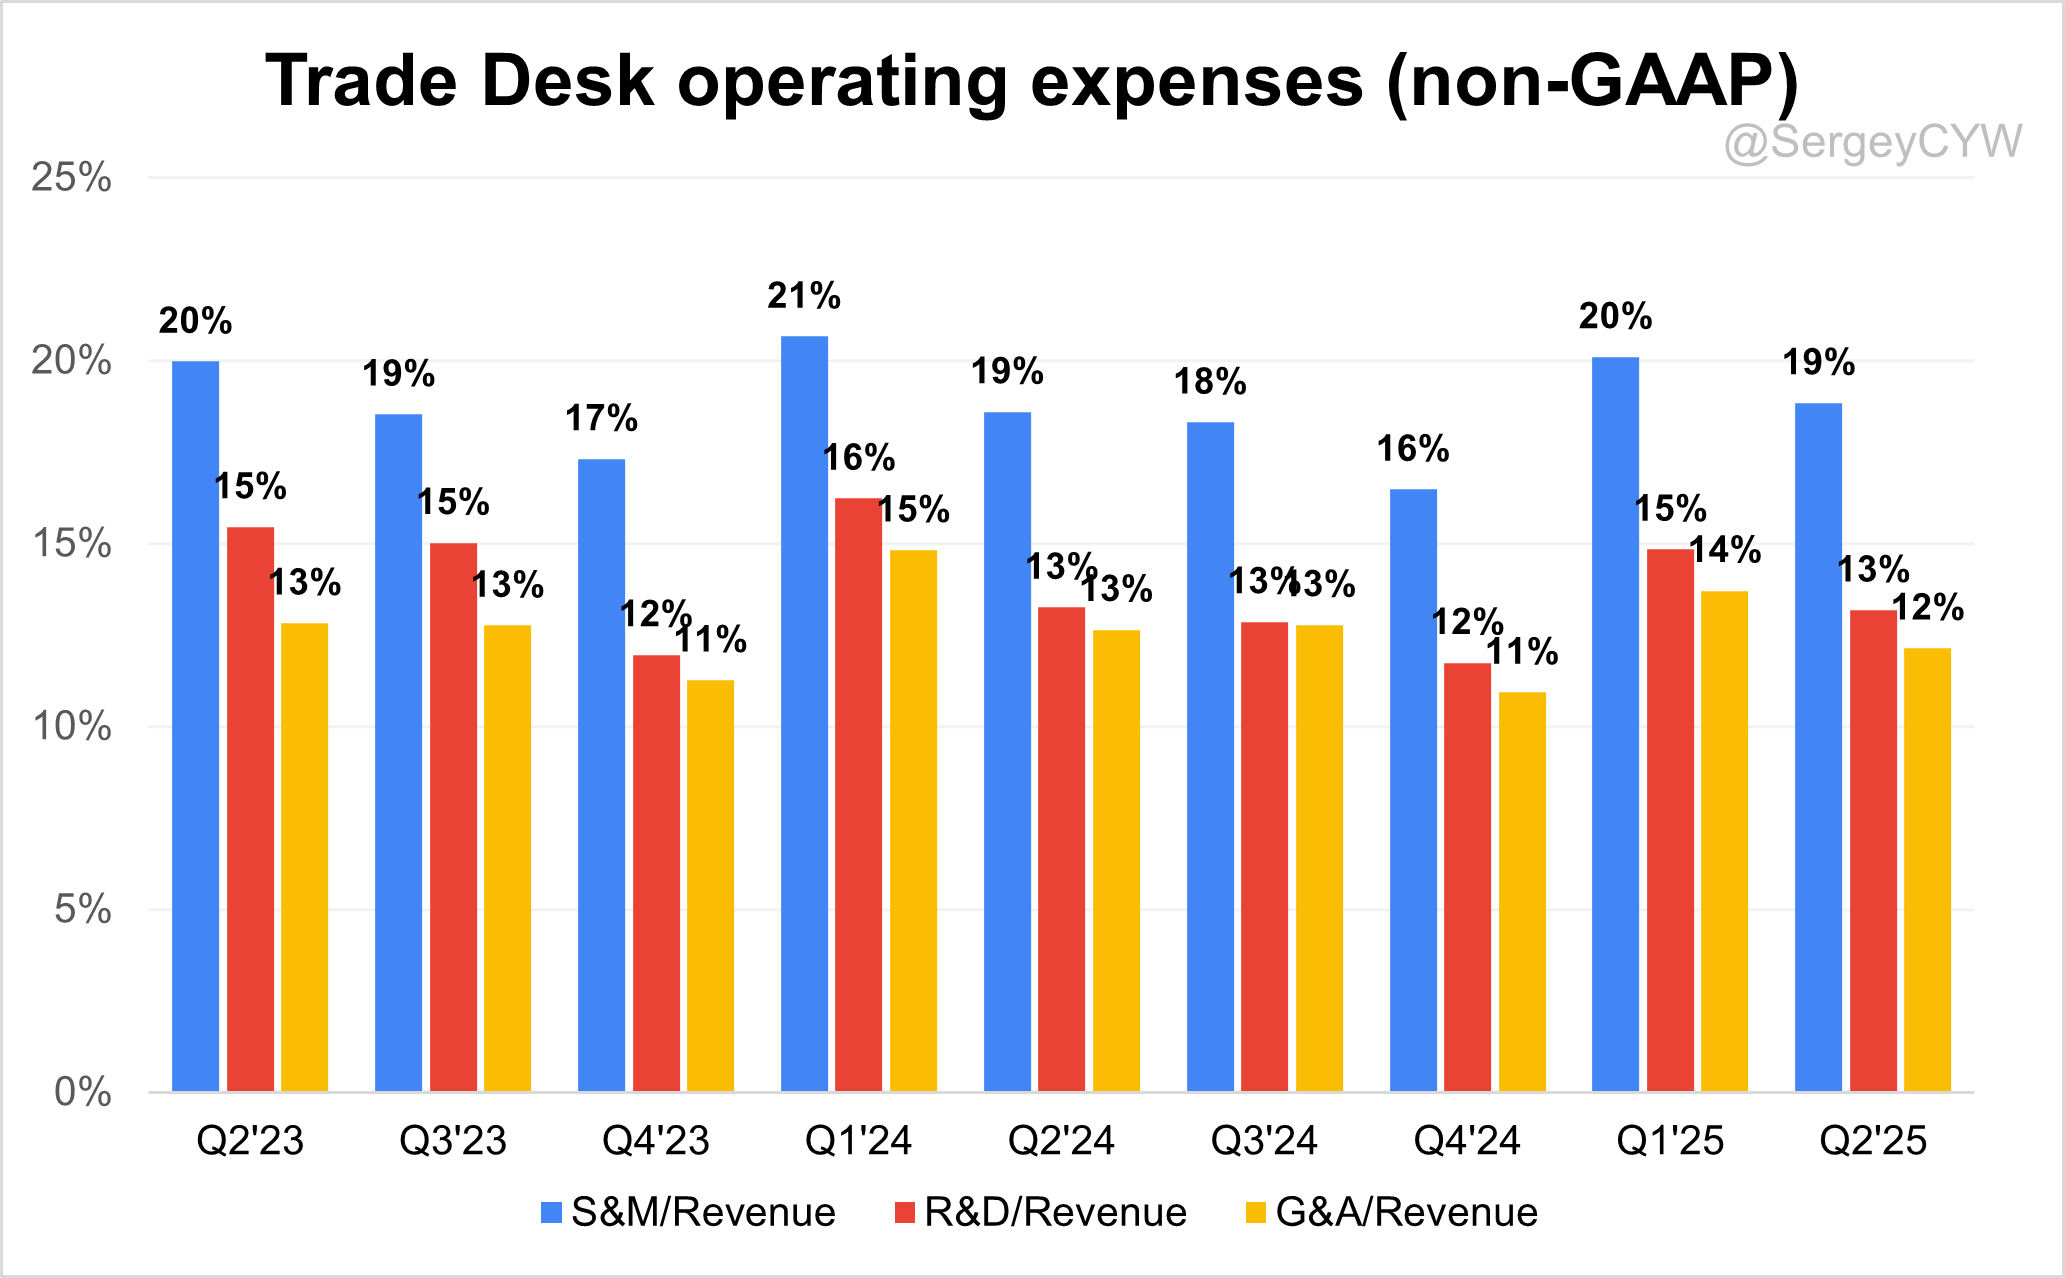
Operating expenses
$TTD The Trade Desk’s non-GAAP operating expenses have decreased, driven by reductions in S&M, R&D, and G&A spending.
Sales & Marketing (S&M) expenses declined from 19% to 20% over the past two years.
R&D expenses fell from 15% to 13% of revenue, though they remain high, supporting continued investment in innovation.
General & Administrative (G&A) expenses slightly decreased to 12%.
Balance Sheet
$TTD Balance Sheet: Total debt stands at $344M, while The Trade Desk holds $1,687M in cash and cash equivalents, exceeding total debt and ensuring a healthy balance sheet.

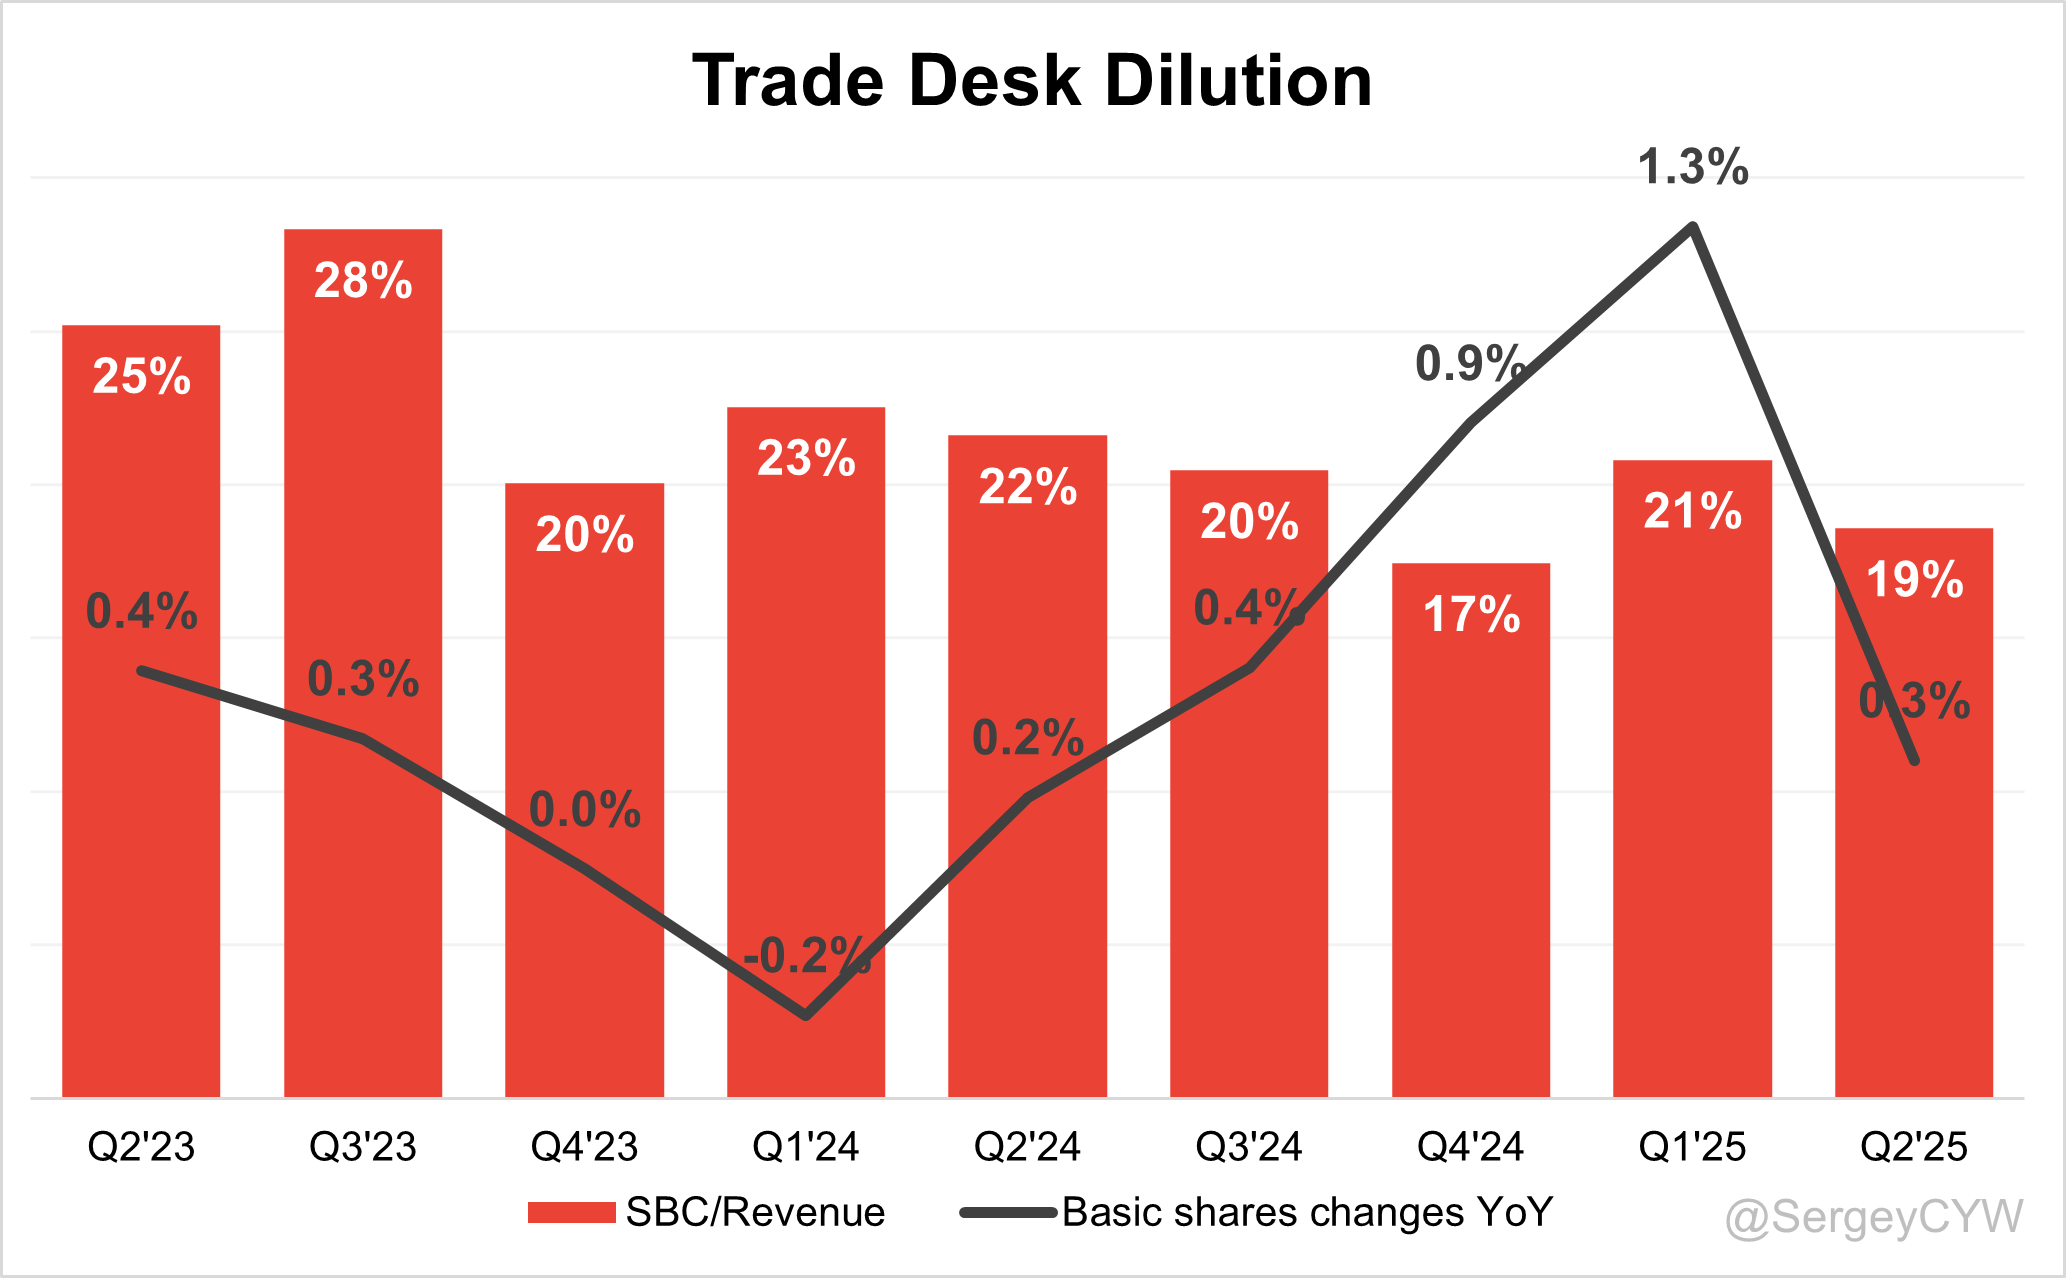
Dilution
$TTD Shareholder Dilution: The Trade Desk’s stock-based compensation (SBC) expenses declined over the past year to 19% of revenue, which is in line with the SaaS company average.
Shareholder dilution remains at an acceptable level, with a modest 0.3% YoY increase in the weighted-average number of basic common shares outstanding.
In Q2 2025 The Trade Desk remained active in its share repurchase program. The company used $261 million of cash to repurchase its Class A common stock during the quarter. Management noted the program is funded by a strong balance sheet and consistent cash flow generation.
The Trade Desk maintains a strong balance sheet with $1.68 billion in cash, cash equivalents, and short-term investments, and carries no debt, allowing for continued opportunistic repurchases.
9. Conclusion
After an unexpectedly weak Q4 2024 for $TTD, with revenue missing estimates by -2.1%, Q1 2025 was very strong, with revenue beating guidance by a record 7.1%, which gave confidence in a continued strong growth trajectory.
But Q2 turned out to be quite weak. The company beat its forecast by only 1.8% and issued a mediocre outlook for the next quarter. If Q3 guidance is beaten at the same level as Q2, then Q3 revenue growth would slow to +16.2%. However, it’s worth noting that excluding the benefit of U.S. political advertising in Q3 2024, the underlying growth rate is estimated at ~18%. Management also highlighted that Kokai feature velocity is accelerating.
Management framed guidance for Q3 2025 conservatively, citing ongoing macro pressures on multinational advertisers in auto and consumer packaged goods. Still, the weak beat in Q2 raises questions about how “conservative” that guidance really is.
The Trade Desk continues to be recognized as a category leader — highlighted in the SPARK Matrix for Ad Tech, the Forrester Wave, and IDC, which positioned TTD in the Leaders category in its 2025 IDC MarketScape. The company has also maintained a customer retention rate above 95% in recent years.
TTD remains the largest independent, objective platform, positioned against vertically integrated players like Amazon and Google.
The global advertising market is approaching $1 trillion TAM, with CTV advertising projected to grow at a 21.2% CAGR, reaching $31.47 billion by 2027 — a key focus area for TTD.
International growth has outpaced North America for ten consecutive quarters, now representing 14% of spend, with growth led by CTV adoption.
$TTD shares have dropped 62.4% from their 52-week high, significantly compressing valuation multiples. The stock still trades near historical lows and appears undervalued relative to other digital advertising companies, given the expected revenue growth.
However, the key question remains the continued deceleration of revenue growth. If analysts keep revising growth estimates downward, a stock that once looked undervalued could quickly become overvalued.
The critical factor will be how much the company beats its Q3 forecast. In Q1, the beat was a strong 7.1%. If Q3 shows a similar strong beat, it would confirm management’s guidance was indeed conservative and that revenue growth is stabilizing. For now, I’m neither adding nor trimming my position — I’ll wait for Q3 results.
The stock’s valuation has fallen sharply, and $TTD currently represents 3.1% of my portfolio.
Thank you for reading!
Follow Sergey for more frequent updates on X/Twitter and Threads, and on LinkedIn. For visual infographics, check out Instagram, and for portfolio changes, follow him on SavvyTrader.
Disclaimer: This earnings review is for informational purposes only and does not constitute financial, investment, or trading advice.
Here is what my Premium Members can expect:
Top Monthly Picks - Each month, I will select a few stocks that I find likely to outperform.
These picks will focus more on short-term pricing movements and swift through market narratives.
Recent developments.
Unwarranted pullbacks.
Insider activity.
Potential catalysts.
Deep Dives – 8,000+ word detailed analysis of a company, delivered in 3 Parts.
Part 1 – Brief History of the company and its Business Model.
Part 2 – Management, Moats, Competitors, and Risks.
Part 3 – Opportunities, Financial Analysis, and a Valuation Model.
You can expect a comprehensive research report that is educational, interesting, and provides actionable insights!
To see what you can expect, read my Palantir Deep Dive!
Members of the Premium service get access to my library of 11 Deep Dives and to all future Deep Dives, which will be released on a semi-monthly basis.
Investment Cases – A short, concise report with actionable insights.
This report is about the size of a single part of a Deep Dive.
Focused Investment Thesis
Main drivers of the Bull Case
Valuation Model
To see what you can expect, read my Oscar Health Investment Case!
Earnings Reviews and Updates – For companies that are of great interest to me and my readers, I will provide regular quarterly or semi-annual updates after earnings reports.
Financial performance
Business Update
New developments
Updated Valuation Model
To see what you can expect, read my Google Q2 2025 Earnings Review!
Pricing Structure
I strive to build a long-term relationship with my Premium subscribers, so I have chosen a pricing structure that emphasizes annual subscriptions.
The standard practice is to give 2 months free for annual plans, but I have decided to give 6!
Small note, please go to the website to purchase the subscription, as if you do it on the iOS app, you have to pay the 30% Apple Tax. (The plan cost more there)
Thank you for being a reader. I look forward to seeing you on Global Equity Briefing!
Join the Global Equity Briefing Premium Service.
Equity Research Report List

You can follow me on Social Media below:
X(Twitter): TheRayMyers
Threads: @global_equity_briefing
LinkedIn: TheRayMyers
Disclaimer: Global Equity Briefing by Ray Myers
The information provided in the “Global Equity Briefing” newsletter is for informational purposes only and does not constitute financial advice, investment recommendations, or an offer or solicitation to buy or sell any securities. Ray Myers, as the author, is not a registered financial advisor, and readers should consult with their own financial advisors before making any investment decisions.
The content presented in this newsletter is based on publicly available information and sources believed to be reliable. However, Ray Myers does not guarantee the accuracy, completeness, or timeliness of the information provided. The author assumes no responsibility or liability for any errors or omissions in the content or for any actions taken in reliance on the information presented.
Readers should be aware that investing involves risks, and past performance is not indicative of future results. The author may or may not hold positions in the companies mentioned in the “Global Equity Briefing” report. Any investment decisions made based on the information in this newsletter are at the sole discretion of the reader, and they assume full responsibility for their own investment activities.
 | A guest post by
|