
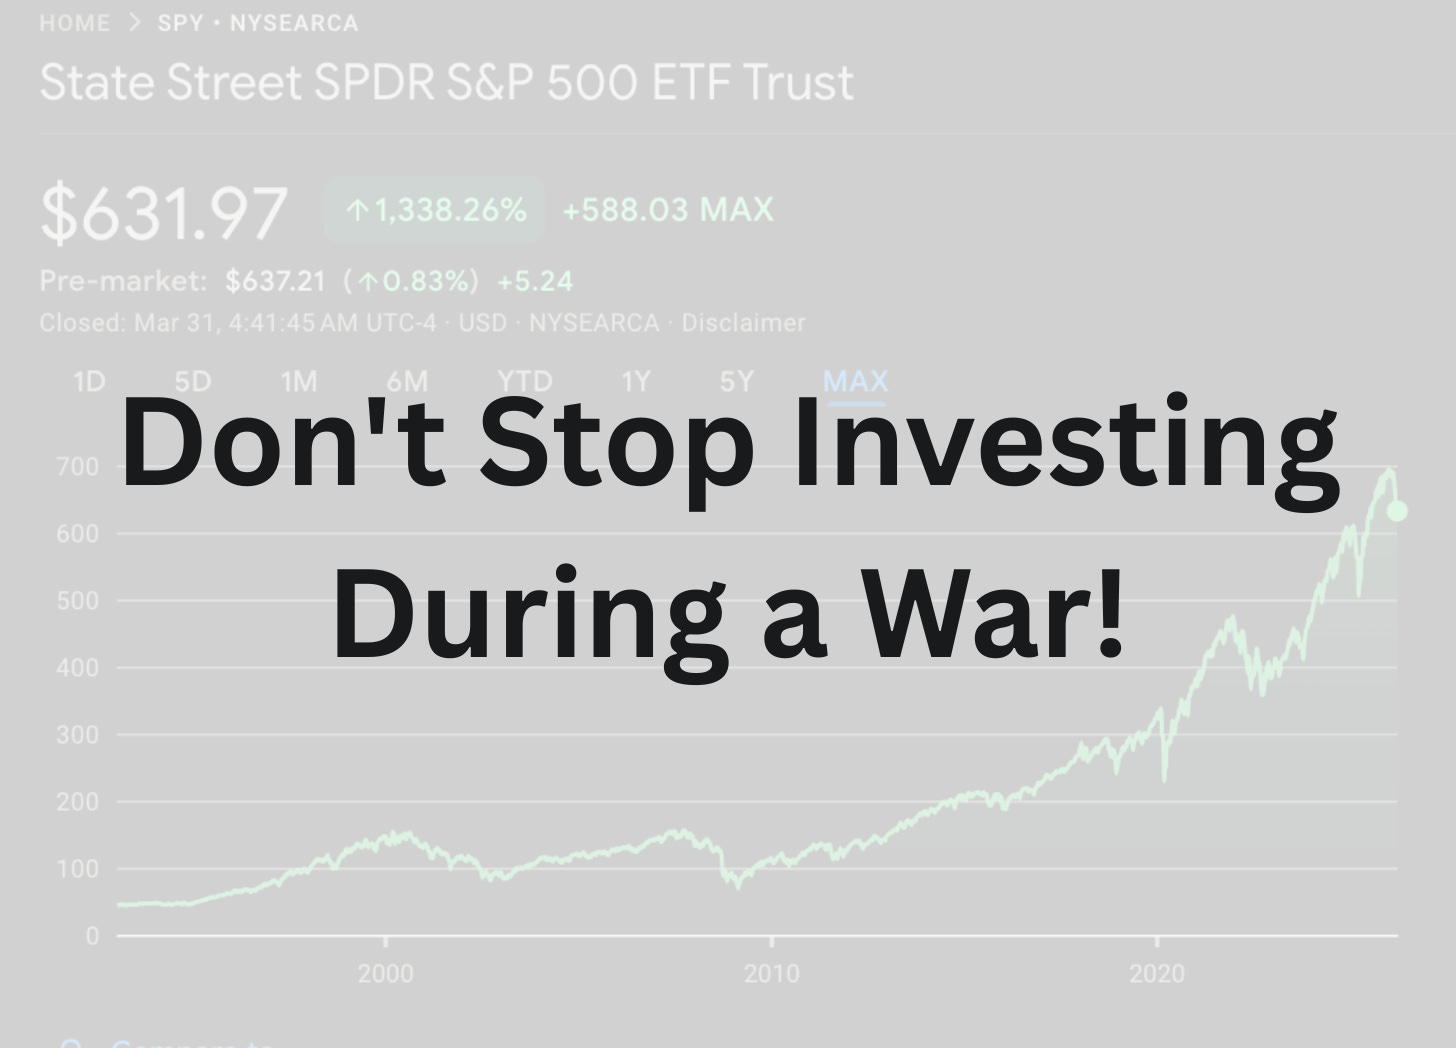
Don't Stop Investing During a War!
Why its important to not panic during the Iran War!

As the Iran War enters its second month, we are starting to see more panic in the markets.
Oil price flirting with the $120s
Asian stock markets are falling, activating circuit breakers
EU natural gas prices are jumping to multi-year highs
Gasoline prices are rising worldwide
Fears of supply chain disruptions
War creates uncertainty, volatility, and fear in markets, but it doesn’t automatically mean you should stop investing.
In fact, history shows that staying invested or even better continuing to invest often performs better than trying to time exits and re-entries.
The natural human instinct during times of instability is to seek safety, which usually means selling stocks and moving capital into cash.
However, an analysis of historical market behavior suggests that withdrawing from the market during wartime is often a strategic error.
History demonstrates that financial markets possess a remarkable capacity to absorb shocks, and economies are far more flexible than popular doom narratives suggest.
1. What Happens During a War
The behavior of financial markets during military conflicts typically follows a cyclical pattern of anticipation, shock, and adaptation.
While every war has unique characteristics, the general principles of market reaction remain consistent across different eras and geographies. Investors who understand these phases are better equipped to resist panic and identify opportunities where others see only risk.
Short-term volatility
Medium-term stabilization
Long-term recovery
1.1. Short-term volatility
In the immediate aftermath of a military strike or an invasion, stock markets almost always experience sharp drops. This initial reaction is driven by a combination of high volatility and panic selling as the sudden removal of certainty forces a repricing of global risk.
This is what we are seeing now!

As the United States and Israel launched air strikes against Iran on February 28, 2026, global markets reacted with immediate distress, and oil prices jumped. This mirrors historical events where surprise or sudden escalation led to significant drawdowns.
Data from twenty major military interventions since World War II shows that the S&P 500 falls by an average of 6% from the initial market impact to the trough level. This decline is often exacerbated in surprise wars where investors have not had time to price in the possibility of conflict.
Events such as the bombing of Pearl Harbor in 1941 and the invasion of South Korea in 1950 hit harder because they lacked a long lead-up period. In these cases, the market experiences a gap down as traders scramble to adjust their portfolios to a new reality of wartime spending and potential supply chain disruptions.
However, the duration of this initial dip is often shorter than expected.
Despite the length of some conflicts, the market historically takes an average of only 28 days to return to the levels seen prior to the event. This suggests that the initial shock is more about the psychological adjustment to a new risk environment than a permanent destruction of value.
However, certain oil shocks have proven more painful. The 1973 Yom Kippur War and the subsequent Arab oil embargo caused the S&P 500 to trade down by 16.1%, while Iraq’s 1990 invasion of Kuwait led to a 15.9% decline.
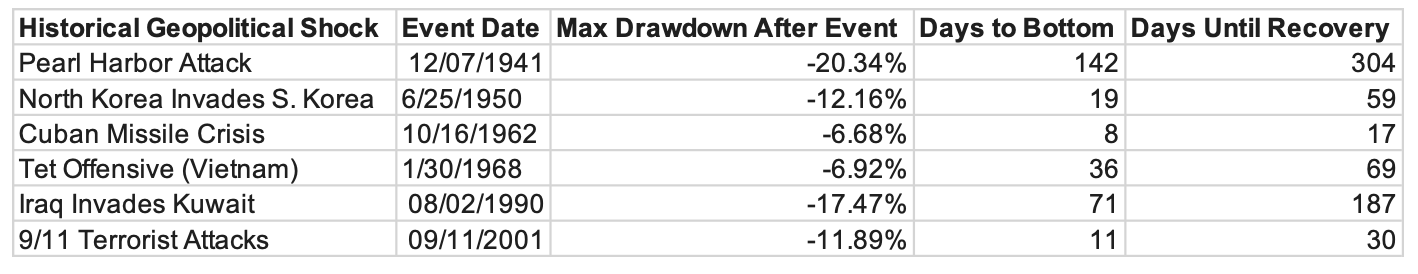
Table data indicates that while drawdowns can be significant, the time to recovery is often measured in weeks or months rather than years.
1.2. Medium-term stabilization
Once the fog of war begins to lift and the scope of the conflict becomes modeled, the market enters a period of stabilization.
Investors shift from emotional selling to a more calculated assessment of how the war will affect specific industries and the broader economy. During this phase, partial recoveries are common as the initial worst-case scenarios fail to materialize.
The uncertainty before a war often creates more perceived risk than the war itself!
Once a conflict is certain, it can be modeled as a risk factor, allowing markets to price it accurately. For example, leading up to the 2003 Iraq War, markets were depressed by pre-war jitters.
However, after the invasion began, the S&P 500 and the Australian ASX 200 both recovered significantly, gaining more than 35% and 26% respectively by the end of 2003.
In the medium term, specific sectors often begin to outperform.
Defense and defense-related companies, such as those in steel, coal, and aerospace, frequently see their stock volatility decrease as wartime contracts provide stable and predictable revenue streams.
This period also sees a re-evaluation of energy prices. During the 2022 Ukraine War, while oil initially peaked at nearly $124 per barrel, the market selloff was less acute than previous shocks because it became evident that Russian crude supplies would not be completely removed from the global market.
1.3. Long-term recovery
The long-term trajectory of the stock market is overwhelmingly positive, even when interrupted by major wars.

Unless a war directly destroys the domestic economy and its productive capacity, the market tends to recover and eventually reach new highs. This resilience is visible in the annualized returns of the S&P 500 across six major historical conflicts.
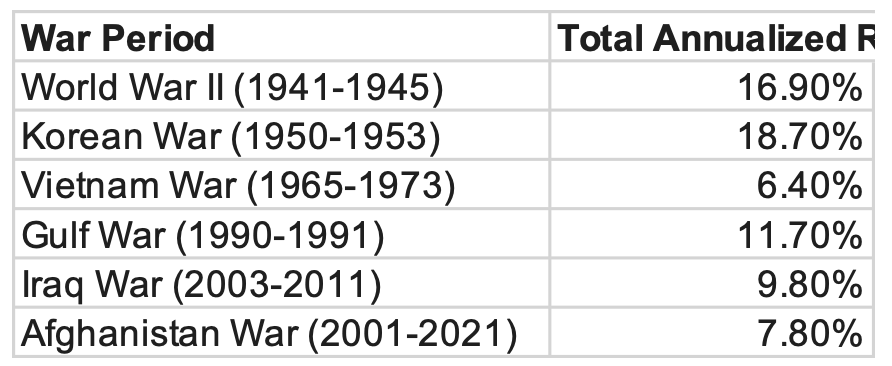
Data varies based on the source and methodology, but the general directional principle is accurate.
It shows that US large-cap stocks delivered positive returns across all major 20th and 21st-century conflicts.
This long-term growth is fueled by the fact that the broader economic factors, such as innovation, interest rates, and corporate earnings, eventually matter much more than the temporary impact of war.
For instance, during the Afghanistan and Iraq wars, the 2008 recession caused a major downward trend, but this was a separate macroeconomic event not directly tied to the military conflicts themselves.
The key for long-term investors is to avoid exiting the market during the mid-war turbulence. Those who gave up and stayed in cash after the 1973 oil shock missed the substantial market gains that began in the 1980s.
2. Economies are Flexible
A recurring mistake I see investors make is that they underestimate the flexibility of the economy.
Experts and media often issue doom predictions at the start of a crisis, assuming that supply chains are rigid and markets will break under pressure. However, modern economies are highly adaptive systems capable of rerouting resources and finding workarounds in record time.
Let’s look at a few examples:
Covid
Ukraine War
Current energy rerouting
2.1. Covid
The COVID-19 pandemic provides a powerful example of economies outperforming the worst-case forecasts.
In early 2020, the International Monetary Fund described the “Great Lockdown” as the worst recession since the Great Depression, predicting a cumulative loss to global GDP of $9T over two years.
While the 2020 contraction of 3.5% was severe, the recovery was the fastest in several decades. By 2021, the US economy grew by 5.5%, its fastest pace since 1984, as businesses and households learned to adjust through digital technologies and shifted consumption patterns.
The vaccine was created and distributed in record time, and instead of the worst global depression, we got a few slow and very weird years.
2.2. Ukraine War
Similarly, the 2022 invasion of Ukraine triggered warnings of a permanent “global food crisis.” I saw some analysts predicting the worst famine since Mao, and estimates of tens of millions of deaths.

While food prices reached an all-time high in March 2022, they fell below pre-invasion levels by December of that same year.
Global cereal stocks were at historically high levels, and alternative shipping routes were established to move grain. Even in Ukraine, a country under direct assault, the economy showed remarkable resilience. By late 2022, nearly 65% of surveyed employees were still working in private enterprises, and essential services like electricity and internet remained functional in major cities despite Russia’s persistent bombing of civilian infrastructure.
2.3. Current energy rerouting
The conflict with Iran in 2026 has provided the most recent proof of economic agility.
Following US and Israeli strikes in late February, Iran effectively shut down the Strait of Hormuz, a waterway that normally handles 20% of the world’s oil.
The shutdown caused tanker traffic to drop by 90% in the first week of March 2026. While doom narratives predicted a total energy collapse, regional players activated decades-old contingency plans with surprising speed.
The Saudi East-West Pipeline, also known as Petroline, became a central lifeline. Built during the 1980s as an insurance policy, it reached its full capacity of 7 million barrels per day on March 28, 2026.
By moving oil across the kingdom to the Red Sea port of Yanbu, Saudi Arabia was able to maintain 50% to 70% of its pre-war export volumes.
Other critical rerouting efforts include:
UAE Gulf of Oman Pipeline: The Habshan-Fujairah pipeline moved approximately 1.62 mbpd to the coast, bypassing the Strait of Hormuz entirely.
Iraq-Turkey Pipeline: On March 18, 2026, the Iraqi government and the Kurdistan Regional Government reached a deal to restart the Kirkuk-Ceyhan pipeline. This route, which had been shut for over a decade, resumed pumping at 250,000 to 300,000 bpd to the Turkish Mediterranean port of Ceyhan.
Global Reserves: The IEA launched the largest emergency oil reserve release in its history, totaling 400M barrels, to stabilize prices as the rerouting took place.
The ability of these nations to rapidly deploy spare infrastructure reinforces the view that economies are not static and can find ways to survive even the closure of major chokepoints.
The longer this closure goes, the more countermeasures will be implemented.
3. Continuing to invest makes sense
While the headlines focus on destruction, the investor’s focus must remain on value and time.
There are 3 clear arguments for continuing to invest during a war:
The opportunity presented by lower prices
Dollar-cost averaging
Long-term compounding
3.1. Lower prices equal opportunity
Market panics driven by war often push the prices of fundamentally sound companies below their fair value.
Paradoxically, the stock market becomes one of the few stores where consumers tend to run away when things go on sale.
When the news is at its worst, the war premium factored into prices is at its highest. For example, before the 2003 Iraq invasion, oil prices included a premium of $5 to $15 per barrel due to the threat of war. Once the war began and the initial outcome became clear, oil prices in New York plunged by a record $10 in a single day.
Investors who bought during the period of maximum uncertainty were able to purchase assets at a discount before the fear premium evaporated.
History suggests that the best time to put money to work is when everyone else is freaking out, as generational lows are often formed during these periods of peak emotional distress.
3.2. Dollar-cost averaging
Dollar-cost averaging (DCA) involves putting a fixed amount of money into the market at set intervals.
When that salary check hits the account, you should allocate a certain percentage of it towards investing.
During periods of war-driven volatility, DCA ensures that an investor buys more shares when prices are low and fewer shares when prices are high.

This smooths out the average entry price and removes the need to perfectly time the market’s bottom, a feat that is nearly impossible during a geopolitical crisis.
The 2003 Iraq War serves as a case study for this approach. Leading up to the conflict, volatility was extreme, and markets declined. However, those who continued their regular investment schedules through the trough in March 2003 benefited from a massive recovery by year-end.
In today’s context, investors in early 2026 who continue to DCA into the market are essentially taking advantage of the Hormuz discount on stocks, betting that the eventual reopening of the strait will lead to a significant repricing of assets.
We saw this during Covid, when panic caused a huge sell-off, which quickly recovered.
We saw this during the Ukraine War, when panic caused a huge sell-off, which quickly recovered.
We will probably see this after the current Iran War, when panic caused sell-off could quickly turn into a recovery.
3.3. Long-term horizon matters
For an investor with a 5-20-year horizon, the short-term shocks of war are less significant than the long-term upward trend of the economy.
Market drawdowns of 10% or more occur in more than half of all years since 1980, regardless of whether there is a war. Furthermore, midterm election years, like 2026, historically experience peak-to-trough declines of about 20%, yet they are almost always followed by robust rebounds to new highs.
If an investor’s goal is retirement or long-term wealth, the daily fluctuations caused by Iranian missile threats or US naval movements are noise.
The focus should remain on the underlying drivers of their stock growth:
Technological advancement
Demand trends
Market share growth
Growing TAM
Improving margins
Product pipeline
Etc
Even messy or prolonged wars eventually bring enough clarity to ease investor anxiety and stabilize markets, as seen in the multi-decade conflict in Afghanistan.
Do you like this report?
Become a Paid Premium member to see dozens of exclusive pay-walled equity research reports such as this.
Curious about which stock I own?
Full portfolio with all holdings, cost basis, and unrealised gains is visible to Premium members. I do weekly updates and detailed monthly reviews. Premium members are also notified of all sales and purchases using the pay-walled Substack Chat.
The annual plan is available for 50% cheaper per month than the monthly plan.
4. Likely Conclusions of the Iran War
It is true that the 2026 war with Iran is an important conflict with direct major implications for the global economy and markets.
The way I see it, there are 4 possible scenarios for the war to end:
Total Iranian victory and establishment of the Hormuz “toll road.”
Total US and Israeli victory and a friendly regime in Iran.
Long painfull ground war that will last many years.
Trump pulls back and encourages internal uprising.
4.1. Total Iranian victory and Hormuz as a “toll road.”
This is the least likely scenario.
In this outcome, Iran would achieve effective military control, essentially closing the Strait of Hormuz to its enemies while allowing friendly nations (China and Russia) to pass for free and charging a toll fee for the others.
This would be a disaster for Trump and the Gulf countries, so this scenario will not be permitted.
Furthermore, Iran does not have the naval or air power to maintain a total blockade against the combined strength of the US and Israel. The US Navy dominates the Strait of Hormuz, and any attempt by Iran to fully control it would trigger an overwhelming military retaliation that Tehran likely cannot survive.
Experts note that Iran’s current strategy is one of small control and deterrence rather than seeking to dominate global shipping sustainably.
Such a scenario would be catastrophic for global stocks in the short-to-medium term. Oil prices could reach $150 to $200 per barrel, leading to high inflation and a possible global recession.
4.2. Total US/Israel victory and a friendly Iranian regime
This scenario involves a complete collapse of the current Iranian government and the installation of a pro-Western regime.
While being the stated goal of Trump, this is considered very unlikely.
This is not in the interest of Russia and China, so these countries will provide ample military and financial support to any remaining old regime factions.
Moreover, history in Iraq and Afghanistan shows that regime change is extremely difficult, costly, and often results in long-term instability rather than a clean democratic transition.
A full ground invasion of Iran would require hundreds of thousands of troops, which the US does not currently have in the Gulf.
While the US might succeed in destroying nuclear programs or coastal defenses, a clean regime replacement is unlikely.
4.3. Long, painful war lasting years
This scenario envisions a grinding conflict that drags on for years, depleting the resources of all involved parties.
This is also unlikely!
President Trump has shown a historical reluctance to long-term forever wars and lacks broad public support for a multi-year ground conflict in Iran. The 2026 midterm elections in November serve as a critical deadline. Historically, the president’s party loses seats in the midterms, and a stagnant economy caused by a long war would almost certainly lead to Republicans losing power.
There is even talk that a prolonged, unconstitutional war could lead to efforts to impeach the president or key cabinet members if the conflict proves unpopular and expensive.
A long war would lead to a period of sideways market performance characterized by high volatility and low investor confidence, as the affordability crisis for consumers worsens due to sustained energy costs.
4.4. Trump pulls back and encourages internal uprising
This is the most likely scenario.
It fits the pressure without occupation strategy, where the US uses limited strikes and economic sanctions to force a change from within.
Trump has publicly pushed for an internal Iranian uprising and has used troop surges as a coercive diplomatic signal to bring Tehran to the negotiating table. This strategy allows him to “declare victory” early and reduce his military footprint before the November midterms, avoiding the political disaster of a long ground war.
While this off-ramp is strategically attractive, limited strikes do not guarantee a final resolution, and the situation remains unpredictable.
This scenario is the most favorable for the stock market.
Once the threat of a full-scale regional war recedes, the markets would likely experience a relief rally similar to the one seen after the start of the 2003 Iraq War. Investors who stayed the course through the initial strikes would be positioned to capture the gains as the world returns to a state of aggressive continues measures and protests.
Overall, the historical data and current 2026 developments suggest that war is a temporary disruption to a much larger story of economic growth.
Whether through the rerouting of oil via the Saudi East-West pipeline or the inevitable stabilization of market prices as uncertainty clears, the global financial system is built to survive.
For those who can maintain a long-term perspective and avoid the emotional trap of panic selling, continuing to invest during a war is a clear pathway to long-term financial success.
5. Which stocks to invest in?
While the economy and the stocks are likely to recover, one still needs to be smart with their investments.
I am not suggesting simply checking which stock is down the most and buying that one.
Some businesses will naturally be more affected by others. Especially those for which commodity prices drive margins, such as airlines and trucking.
Saturday, I will release an article on how to pick stocks during the current sell-off and which 6 stocks I believe are the best buys right now.

Here is what my Premium Members can expect:
Portfolio Review - Each month, I will present the portfolio performance and discuss my stock watchlist and my best ideas.
Recent developments.
Unwarranted pullbacks.
Insider activity.
Potential catalysts.
Deep Dives – 8,000+ word detailed analysis of a company, delivered in 3 Parts.
Part 1 – Brief History of the company and its Business Model.
Part 2 – Management, Moats, Competitors, and Risks.
Part 3 – Opportunities, Financial Analysis, and a Valuation Model.
You can expect a comprehensive research report that is educational, interesting, and provides actionable insights!
To see what you can expect, read my Palantir Deep Dive!
Members of the Premium service get access to my library of 11 Deep Dives and to all future Deep Dives, which will be released on semi-monthly basis.
Investment Cases – A short, concise report with actionable insights.
This report is about the size of a single part of a Deep Dive.
Focused Investment Thesis
Main drivers of the Bull Case
Valuation Model
To see what you can expect, read my Oscar Health Investment Case!
Earnings Reviews and Updates – For companies that are of great interest to me and my readers, I will provide regular quarterly or semi-annual updates after earnings reports.
Financial performance
Business Update
New developments
Updated Valuation Model
To see what you can expect, read my Google Q2 2025 Earnings Review!
Equity Research Report List
You can follow me on Social Media below:
X(Twitter): TheRayMyers
Threads: @global_equity_briefing
LinkedIn: TheRayMyers
Disclaimer: Global Equity Briefing by Ray Myers
The information provided in the “Global Equity Briefing” newsletter is for informational purposes only and does not constitute financial advice, investment recommendations, or an offer or solicitation to buy or sell any securities. Ray Myers, as the author, is not a registered financial advisor, and readers should consult with their own financial advisors before making any investment decisions.
The content presented in this newsletter is based on publicly available information and sources believed to be reliable. However, Ray Myers does not guarantee the accuracy, completeness, or timeliness of the information provided. The author assumes no responsibility or liability for any errors or omissions in the content or for any actions taken in reliance on the information presented.
Readers should be aware that investing involves risks, and past performance is not indicative of future results. The author may or may not hold positions in the companies mentioned in the “Global Equity Briefing” report. Any investment decisions made based on the information in this newsletter are at the sole discretion of the reader, and they assume full responsibility for their own investment activities.