
Nu Q4 2025 Earnings Review!
Excellent execution once again!

Yesterday, Nu bank reported earnings, and they were again excellent, with the Brazilian fintech executing across all verticals.
Total revenues +56.8% to $4.7B, beating the $4.5B estimate by 3.6%.
Net income +62.6% to $898.5M.
EPS +60.2%, meeting the estimate of $0.18.
ARPU +40.2% to $15.
Cost per ARPU remained stable at 80 cents.
The number of customers increased by 4M, +14.7%, to 131M.
Yet, the stock is down 6% in after-hours, so there was clearly something that the market didn’t like. After going through the results and listening to the earnings call, I believe I have identified 4 key reasons the stock is falling:
1. Regulatory headwind with secured loans in Brazil.
2. One-off cost in Mexico.
3. “Investment Year” guidance.
4. No additional geographic expansion in 2026.
Let’s look at the results for this quarter, and then I will analyze these 4 reasons.

1. Customer Level Results
Nu continues to gain customers faster than anyone could have imagined just a few years ago.
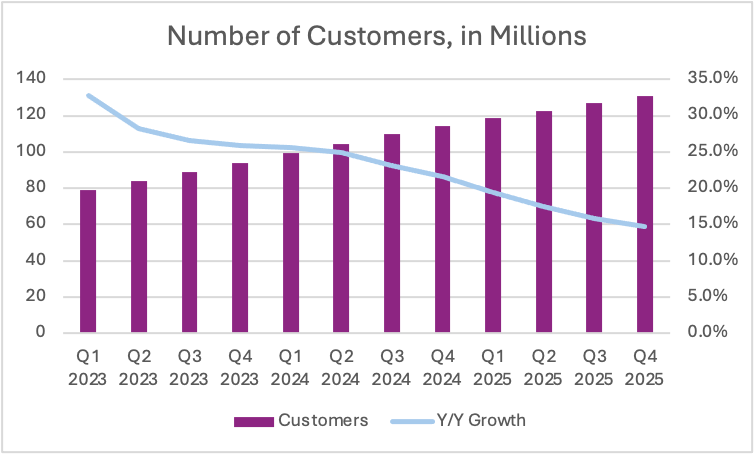
The number of customers grew by 14.7% Y/Y and 3.1% Q/Q to 131M, an increase of 4M!
83% of these customers are monthly active customers, the same as last year. In fact, the activity rate has remained unchanged for 3 years, which is remarkable given the rapid growth.
As one could expect a slight decrease in activity rate after expanding into two new countries and adding tens of millions of new customers.

The company continues to increase its customer market share in its core markets:
62% of Adults in Brazil.
15% in Mexico.
11% in Colombia.
Overall, each active customer generated $15 monthly ARPU in Q4, an increase of 40% Y/Y, and 8.7% Q/Q!
This is incredible growth.
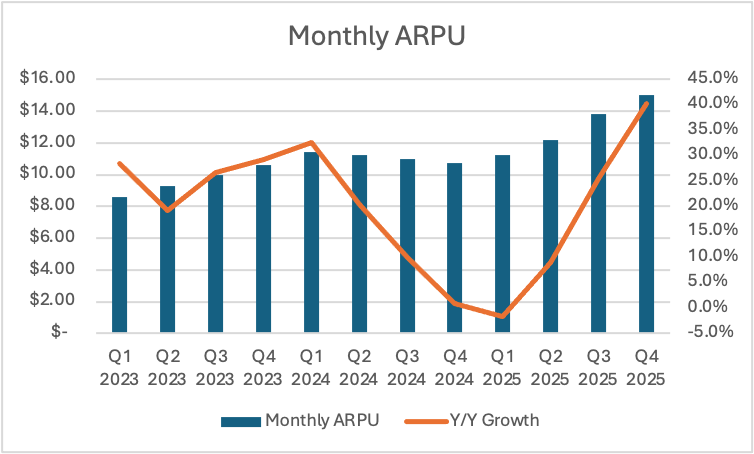
In the graph above, we can see a strong acceleration from Q1 2025, when the company posted a decrease in ARPU by 1.8%. This fall in ARPU caused quite a lot of panic in the Nu investor base, as ARPU growth is a key bull thesis for the company.
This was largely driven by Nu gaining a lot of new, and temporarily under-monetized customers in Mexico and Colombia!
This is what I said last during the Q1 2025 review:
“As Nu develops Mexico and Colombia, ARPU is likely to increase later in the year, especially as Nu releases new products in Mexico after receiving a full banking license. “ Global Equity Briefing
This quarter, we saw exactly that as significant growth in both countries directly contributed to the recovery of the ARPU.
On an FX-neutral basis, ARPU actually grew 25% Y/Y, so the company benefited from a weaker USD.

Per the above graph, it takes Nu between 48 to 60 months to get a new customer to the $15 ARPU, whilst long-term customers generate double the ARPU.
Cost to serve an active customer increased by 11% Y/Y on FXN basis, but remained flat on realized FX.
If we compare the cost to serve an active customer to ARPU, we see that after 1 month, a customer is already at break-even in servicing costs!
If we assume a linear growth in ARPAC from month 1 to 12, in the first year, an active customer will generate Nu $33.36 in revenue, but it would cost only $9.6 to service.
This leaves a lot of room for Nu to utilize marketing as organic customer growth slows down when they begin reaching maturity in certain markets.
There is significant potential to increase ARPU.
“I think a couple of our opportunities really on the revenue side, and as a reminder, our ARPAC is $15 today and our incumbent competitors are something like 40, so we have a significant opportunity to increase ARPAC, is around new cross-sale and new products that we can be delivering to the very significant consumer base that we have. I think everything around cross-sale, everything about using the data that we already have to offer new products and services, it’s a big opportunity, and AI is an enabler.” David Velez Nu Q4 2025 Earnings Call
2. Brazil
Brazil, as Nu’s home and Latin America’s largest country by population and GDP, remains a huge opportunity for the company!
As of Q4 2025, Nu has around 112.7M customers in Brazil, an increase of 10.7% Y/Y.
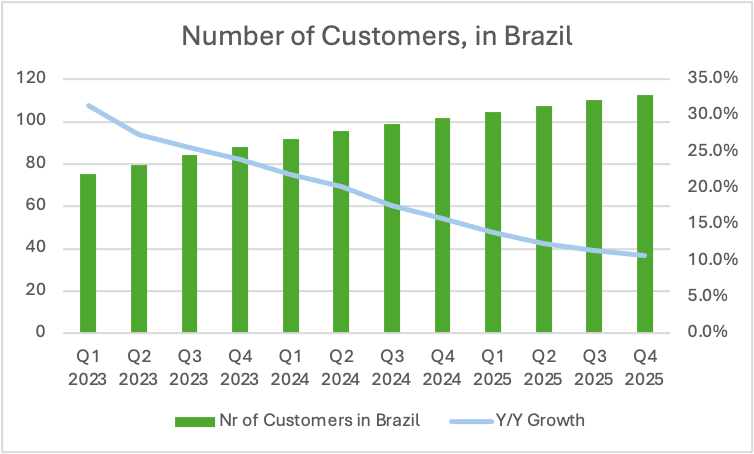
It is quite remarkable that they can add 2.6M customers in a quarter, despite already having 62% of the adult population as customers.
At such a scale, it is becoming harder and harder to acquire new customers, as realistically, it would be crazy if the share of the adult population surpassed 70%. For a single bank to have 70% of the country as customers would be insane.
Thus, it is quite clear that the focus in the future will shift from user growth to user monetization.
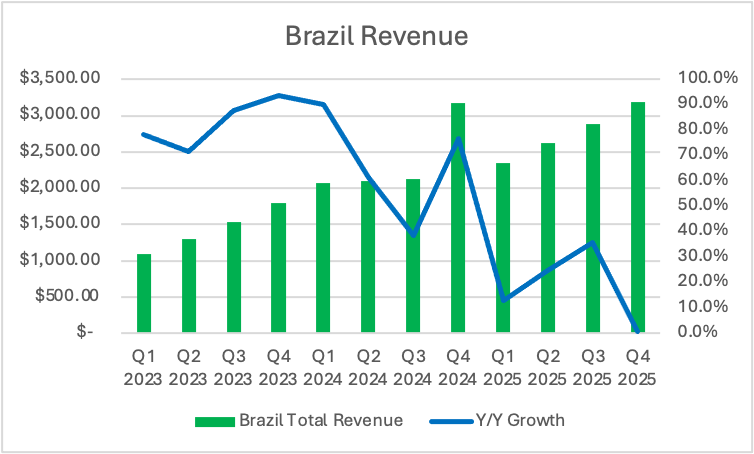
Total revenue in Brazil grew 0.6% Y/Y, to $3.2B!
Please note that total revenue doesn’t match the sum of the geographic revenue, as a lot of corporate HQ revenue is not allocated to a specific geography. This is also how the total revenue grew by 56.8%, despite Brazilian revenue growing more slowly. Looking at quarterly revenue, we see a clear improving trendline.
Unfortunately, this quarter, Nu did not disclose detailed loan origination statistics for Brazil. My guess is that since expansion in Mexico and Colombia is going steadily, the company wants to emphasize its business as a portfolio of loans, rather than just Brazil.
However, as I said in the introduction, there is a regulatory issue in Brazil regarding the Length-of-Service Guarantee Fund (FGTS) loans.
FGTS is a fund is a mandatory unemployment insurance fund for Brazilian workers. Nu had become a market leader in providing loans where this fund acts as collateral, making it a key driver of their secured loans portfolio. On November 1, 2025, new regulations came into effect that restricted the origination of these loans, thus new volumes plummeted 50%.
But this is just one type of loan category on which the company is not overly dependent. Regulations change all the time, and Nu will adapt and just focus on different loan products.
Moving on to deposits, Brazil showed strong growth, attracting $2.8B in new deposits to reach a balance of $33.2B!
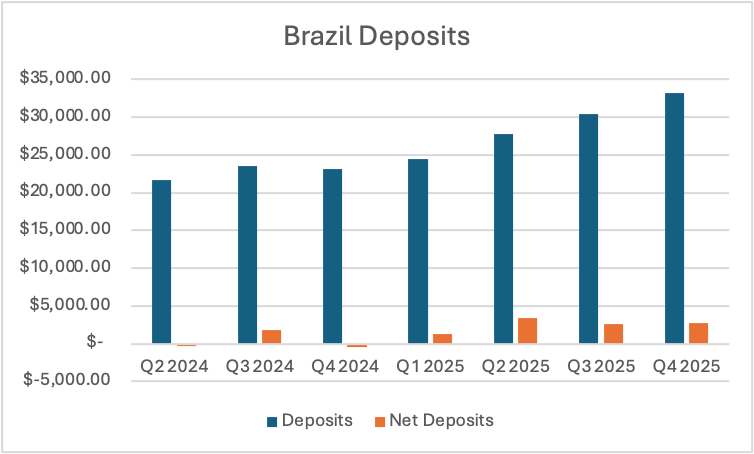
This was an increase of 44% Y/Y, or 9.2% Q/Q, with net deposits growing by 115% compared to Q1 2025.
In the earnings call, this increase in deposits was attributed to deposit growth reflected typical fourth-quarter seasonality, specifically boosted by the thirteenth-month salary bonus.
Additionally, the company said that some of this increase is also attributable to gaining more affluent customers. As we saw during Q2 disclosures, the number of high-income customers rose 13% Y/Y, and they could be responsible for an outsized share of this growth.
Furthermore, the Nu CFO said that the company is focused on attracting and serving what they describe as “Super Core” segment, which consists of people earning BRL 5-12K per month, about $1-2K. The number of customers in this category is growing at 100% per year.
3. Mexico
As of Q4 2025, Nu Mexico has 14.1M customers, around 15% of the adult population.
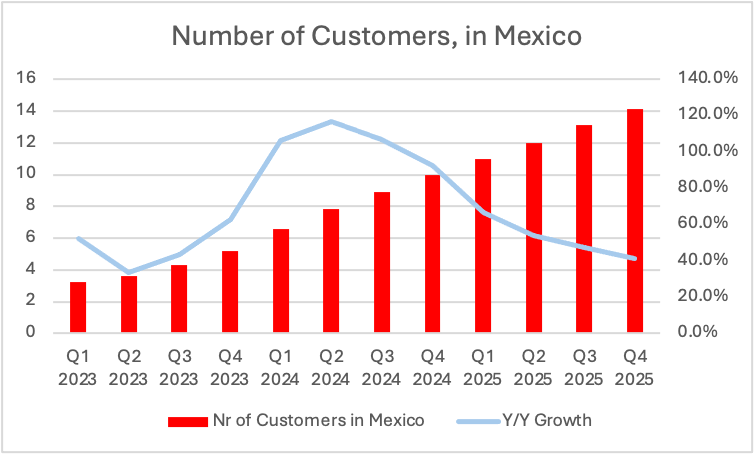
This is an increase of 41% Y/Y and 171% in just 2 years!
While I doubt that Nu can reach as high a penetration as Brazil’s 60%, I am confident there is still a lot of growth left in Mexico.
A reminder that Nu received a full Mexican banking license just a few months ago. Previously, they operated under a non-bank financial institution license (SOFIPO), which is a special Mexican regulatory framework that allows FinTechs to provide some banking services, but with a lot of limitations.
A full banking license enables Nu to offer more services to its clients. This helps it to attract more customers and increase wallet share with existing customers. We are starting to see the results this quarter as Nu Mexico added $200M in deposits!
Now they have a deposit balance of $6.3B, an increase of 40% Y/Y and 3.3% Q/Q.
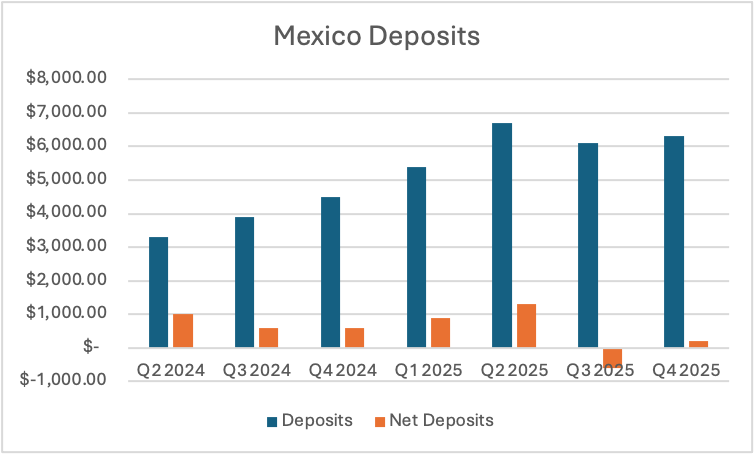
As we can see in the graph above, this was a rebound in net deposits from Q3 2025, when they were negative.
Furthermore, revenue in Mexico declined by 6.8% Y/Y to $265.3M.
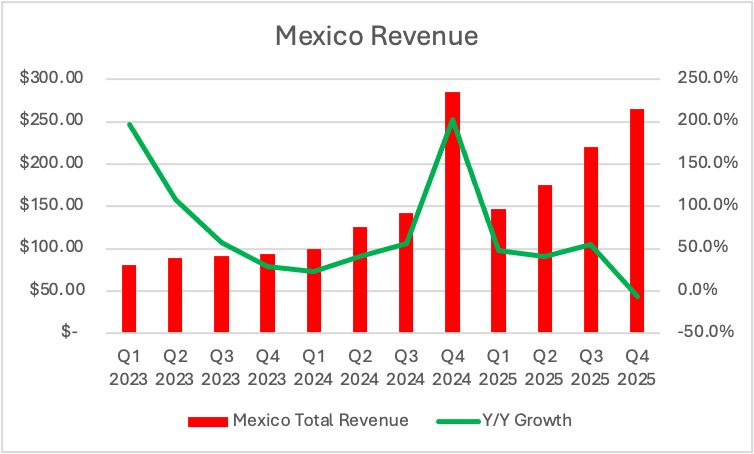
The same as with Brazil revenue, this is an accounting and classification issue. In Q4 2024, a lot of revenues were classified as originating in Mexico and fewer from the HQ. Looking at quarterly growth rates, one can see a clear trendline of steady Q/Q growth, so I am not sure that Y/Y numbers are actually comparable with 2024.
4. Colombia
In Q4 2025, Nu Colombia added 400K customers, reaching 4.2M.
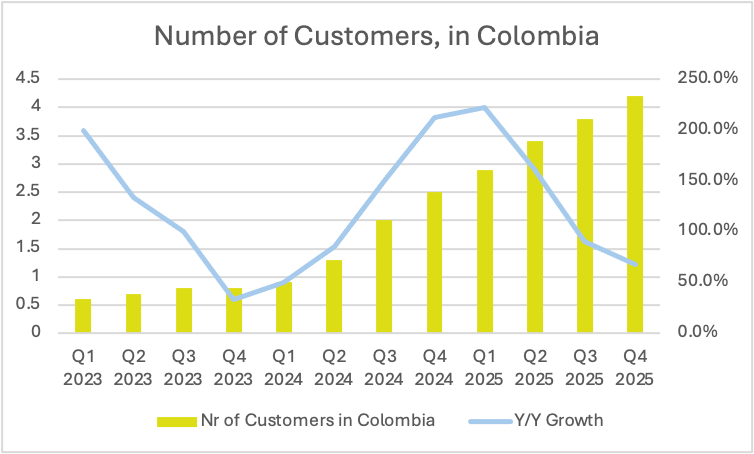
This is an increase of 68% Y/Y and 425% in just 2 years!
Nu Colombia has already onboarded 11% of the adult population, quite impressive considering they only began operations 5 years ago.
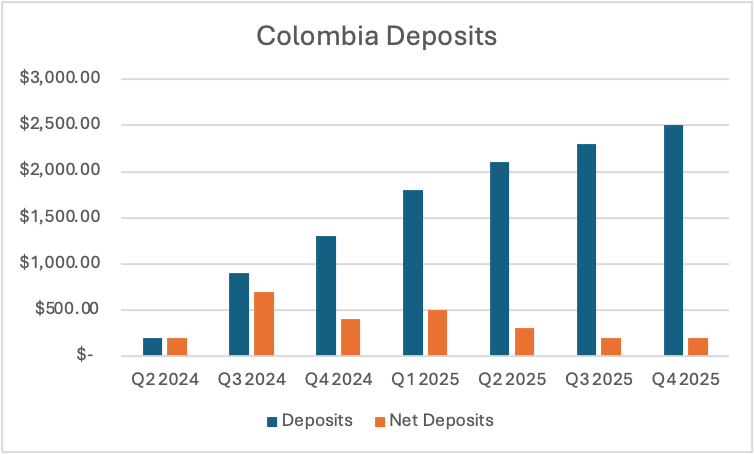
This quarter, Nu Colombia reached $2.5B in deposits, an increase of 92% Y/Y and 8.7% Q/Q!
As we can see in the graph, this is a 10x growth in the deposit base in just a year and a half!
Nu didn’t disclose anything else about Colombia, as the business is still small.
I will be paying close attention to see how Colombia develops. So far, user and deposit growth have been stronger than in Mexico and Brazil at this age in the market.
5. Deposits and Loan Portfolio
Total Nu deposit balance grew 45% Y/Y to $41.9B, driven by a whopping 417% growth in net deposits.
On an FX-neutral basis, deposits grew 29% Y/Y, so this quarter, FX was a tailwind.
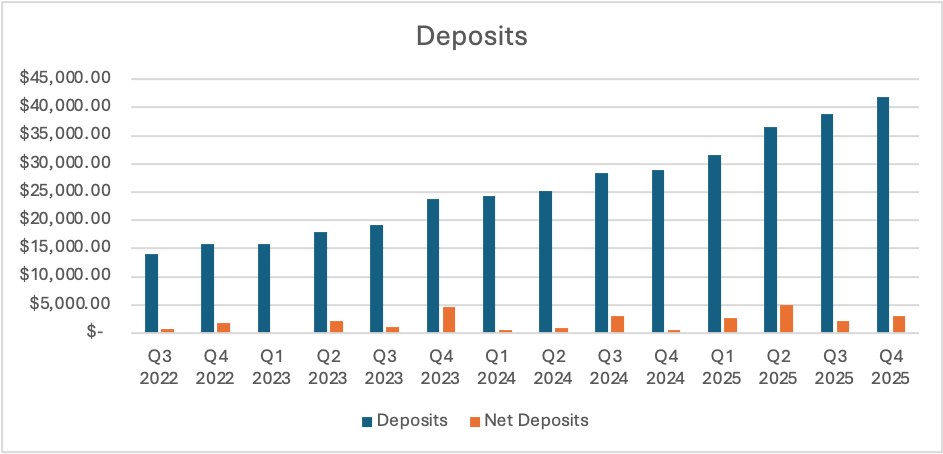
Q4 2025 net deposits of $3.1B were driven by a 350% increase in net deposits per customer!
Banks grow their deposit base for essentially only one reason, to issue more loans to generate interest income.
Total loan portfolio grew 58% Y/Y and 40% FXN to $32.7B.

71% FXN growth in secured loans and 55% FXN growth in unsecured loans were the main contributors to the loan portfolio growth. Meanwhile, the credit card loan share of the portfolio decreased from 71% in Q4 2024 to 67% this quarter.
This change in the portfolio mix displays Nu’s strategy to originate less risky, higher-quality, longer-term loans.
$18.5B of this loan portfolio generates interest, or 56.5%, a large increase from 53.6% in Q4 2024!
This means that Nu is less reliant on revolving credit card balances that are paid off monthly and don’t generate interest.
However, if we look at Q/Q growth in secured loans, we see that it was 0%, as the balance remains at $2.7B. This is directly linked with the regulatory change in Brazil, as the 50% decline in new volumes for the secured unemployment fund loans offset growth in other secured loan categories.
Nevertheless, the quality of their loan portfolio remains stable.

The share of 15-to-90-day nonperforming loans decreased from 4.3% to 4.1% Q/Q, and from 4.2% in Q4 2024.
90+ day NPL also decreased from 6.7% in Q3 to 6.6%.
Such delinquency ratios in a tough macro environment in Brazil demonstrate the quality of Nu’s underwriting!
6. Revenue
Total revenue grew 56.8% to $4.7B, driven by a 60.3% increase in interest income and a 39.1% increase in fee income!
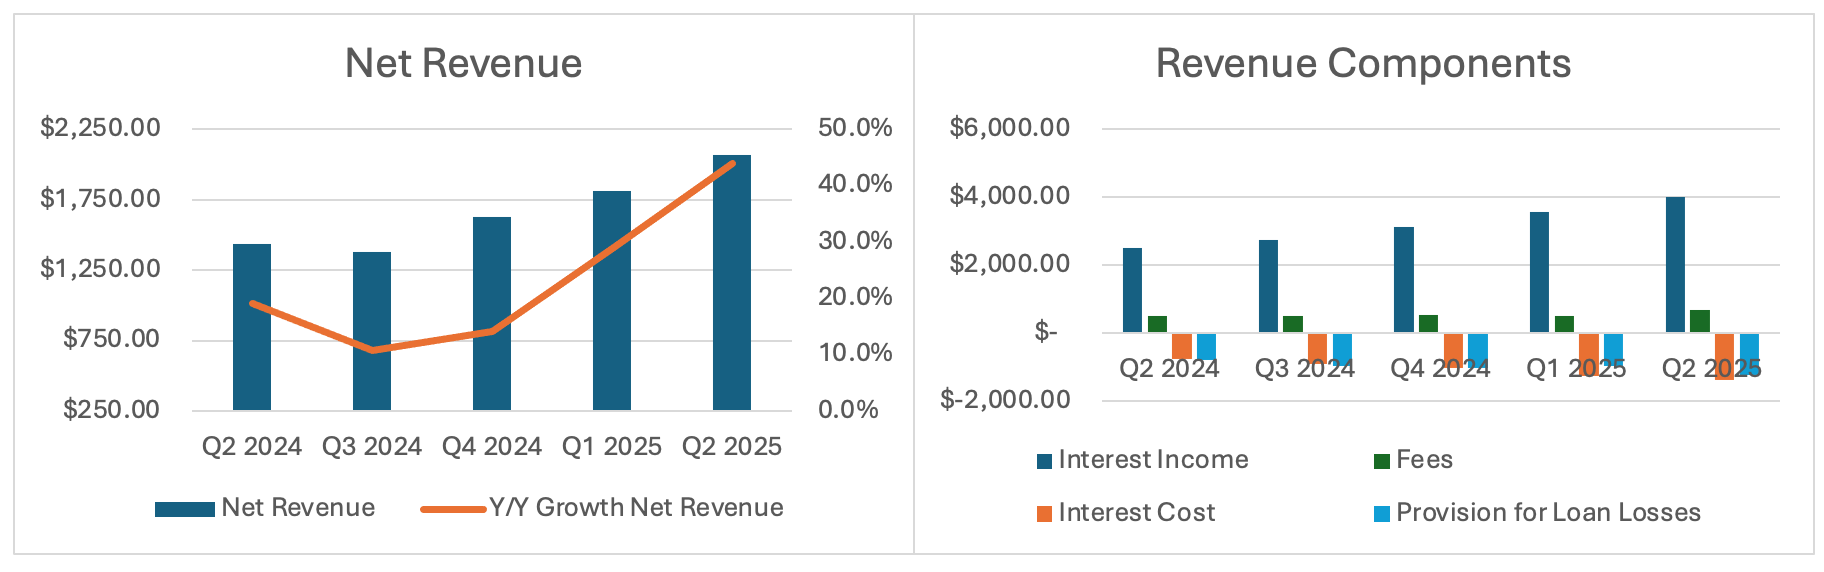
However, net revenue (which I defined as Fees + Interest income – interest cost (NII) – provision for loan losses) grew slightly slower, 43.9% Y/Y to $2.67B.
*(Some have questioned why I do it differently than Nu reports. I do this to for me and to make Nu bank more comparable to other banks. Net revenue is comparable to what Nu calls Gross profit)*
The main causes of this lower growth were a 84.1% increase in interest costs and a 54.4% increase in provision for loan losses.
Despite this strong increase in interest costs, the risk-adjusted net interest margin (risk-adjusted NIM) increased from 9.9% in Q4 2024 to 10.5% this quarter, with net interest income (NII) growing 50.1% to $2.62B.
The higher interest costs were largely caused by Nu more aggressively growing its deposit base in all 3 countries.
Let’s remember that because of banking regulations, deposits from one country can’t be used for loans in another. This means that Nu must build a new capital base in each country.
Provision for loan losses increased more than the NII (54.4% vs 50.1%) because of a strong growth in the overall loan portfolio and a larger share of unsecured loans in the portfolio (25% vs 23%). IFRS 9 requires banks to estimate and recognize future loan losses immediately when a loan is issued.
When a bank issues a lot of loans like Nu did, it books high loan loss provisions before it generates any meaningful interest income from these loans.
Additionally, unsecured loans default at a higher rate, thus they require a higher upfront loss provision.
“Credit loss allowance increased primarily as a function of growth. As we expanded credit card limits and balances, provisions rose mechanically due to front-loaded origination accounting, while underlying credit quality remained stable.” David Velez Nu Q4 2025 Earnings Call
Furthermore, because Nu is building a new deposit base in Mexico and Colombia, its interest expenses are growing much faster than its interest income, and this is affecting net interest income.
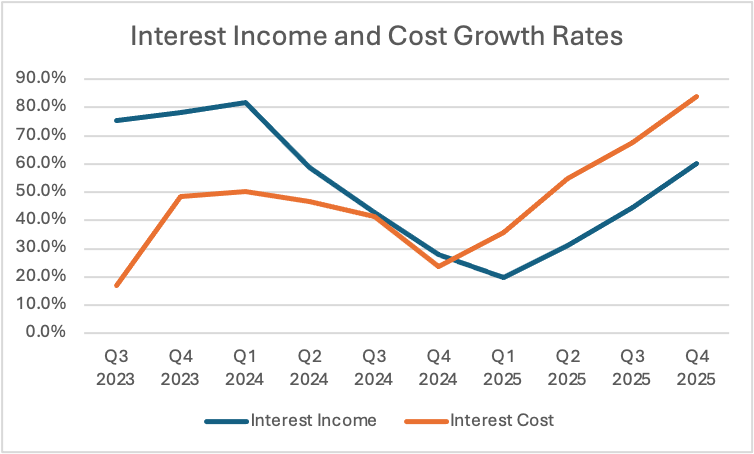
In the above graph, I have placed interest income and interest cost Y/Y growth rates. As we can see, interest cost has grown faster than interest income for 4 quarters in a row. I think this trend could stabilise now, as the company builds out its deposit base.
Additionally, in Q4 2025, interest costs were affected by a one-time $25M regulatory deposit insurance charge in Mexico, which relates to the growth of their deposit portfolio.
Here is what the CFOGuilherme Lago said in the Q242025 earnings call:
“PROSOFIPO is a sector-wide deposit insurance fund to which all Sofipos are required to contribute to. The largest Sofipo in the country, Nu was required to make an extraordinary contribution of approximately $25 million, which is reflected in interest expenses this quarter. This is a one-time, non-recurring regulatory levy, not a reflection of the credit quality or the financial health of our operations in Mexico.”
NIM will increase as Nu 1) issues more loans from the existing deposit base, 2) lowers the cost of funding by attracting a cheaper deposit base.
7. Profitability
In Q4 2025, Nu generated $898.5M in net income, up 62.6% and 50% FXN Y/Y!
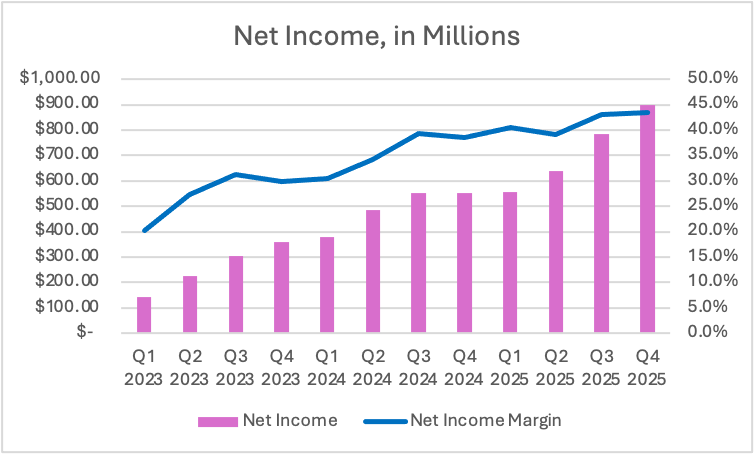
The chart above shows that Nu is a powerhouse of profitability with no signs of slowing down. The net income margin increased Q/Q from 43.1% to 43.5%.
ROE, which basically measures a bank’s return from its net assets, remained stable increased from 29% in Q4 2024 to 33%.
Most banks can only dream of such a high ROE. This level of profitability can only be possible with incredible operational efficiency.

As we already discussed earlier, the cost per active customer increased 11% Y/Y on FXN basis, but still remains at an incredible 80 cents.
Another metric to monitor is the efficiency ratio!

It measures operating expenses as a share of net revenue, and as you can see in the graph above, it has been steadily going down from 24.7% in Q3 2024 to 19.9% today.
Nu is better at using technology to serve a large number of customers than possibly any other bank in the world!
Nu’s efficient operating model allows low prices and high profits. This is a potent combo for explosive global growth!
8. Outlook for 2026
The key reason for the 6% sell-off is that investors believe that the outlook for 2026 has deteriorated!
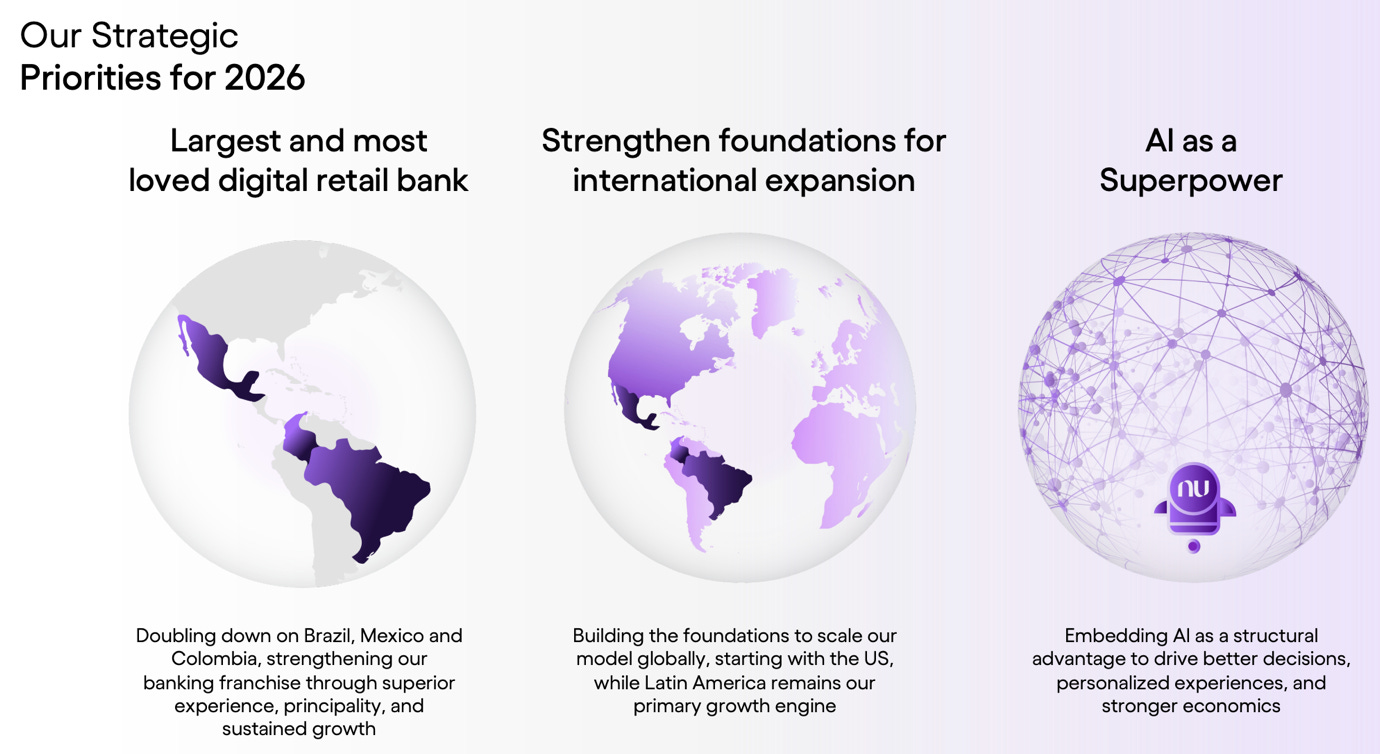
The company said that 2026 will be an “Investment Year”.
“2026 is, in fact, an investment year. We are laying the operational foundations for global expansion and accelerating the adoption of AI and other new technologies across the platform.
These are deliberate investments in long-term capacity building at Nubank, and they will likely put upward pressure on the efficiency ratio in the near term. We are comfortable with this trade-off. The structural drivers of operating leverage, revenue growth, scale, and disciplined cost management remain unchanged, and we expect efficiency to continue improving over the medium term as these investments that we are making today begin to generate returns.” Guilherme Lago, Nu CFO, Q4 2025 Earnings Call
The market is interpreting this as meaning that margins will decline in 2026!
Nu just received its conditional US license, which means that the company now has to fund the US entity and do other regulatory steps to begin operations. This will require significant investments that will likely decrease margins in the short term.
This means that margin growth could stagnate for the next 2-3 years as Nu invests in marketing, technology, and regulatory compliance.
I am perfectly fine with this development, as the potential of the US market is immense.
While it is unlikely that Nu will acquire tens of millions of customers as quickly as they have in Brazil and Mexico, that doesn’t matter. Because of the wealth of the median US citizen, a single US customer could be worth 8x the average Brazilian in terms of profit potential.
However, it could be that the market is overestimating by how much the margins will decrease, due to the regulatory changes in Brazil and increased deposit insurance in Mexico.
I don’t agree with this view,
Firstly, as the company confirmed, the $25M charge in Mexico was a one-off, and not related to the health of the portfolio, just the size of it.
Secondly, the FGTS is just one type of secured loan. That is a tiny fraction of Nu’s overall lending portfolio. Despite the secured FGTS originations falling 50% in Brazil, the overall portfolio grew by 7.6% Q/Q. Nu will simply pivot to other types of loans.
The last likely cause for the drop is that the market could be interpreting Nu saying that they are “Strengthening the foundation for international expansion” as “No additional geographic expansion in 2026 beyond the US”.
This is because many investors view the US expansion as risky and unlikely to succeed, whilst expansion in Latin America is viewed as a natural evolution. I firmly disagree. Many analysts can’t comprehend how this “Brazilian upstart” could take market share from US incumbents. They will be surprised when Nu does just that with cheaper services and better customer experience.
In conclusion, Nu continues execute on its multi-decade growth trajectory to become an international banking leader.
The results of this quarter were once again great, and I don’t see any indications that their strategy is failing.

Here is what my Premium Members can expect:
Portfolio Review - Each month, I will present the portfolio performance and discuss my stock watchlist and my best ideas.
Recent developments.
Unwarranted pullbacks.
Insider activity.
Potential catalysts.
Deep Dives – 8,000+ word detailed analysis of a company, delivered in 3 Parts.
Part 1 – Brief History of the company and its Business Model.
Part 2 – Management, Moats, Competitors, and Risks.
Part 3 – Opportunities, Financial Analysis, and a Valuation Model.
You can expect a comprehensive research report that is educational, interesting, and provides actionable insights!
To see what you can expect, read my Palantir Deep Dive!
Members of the Premium service get access to my library of 11 Deep Dives and to all future Deep Dives, which will be released on semi-monthly basis.
Investment Cases – A short, concise report with actionable insights.
This report is about the size of a single part of a Deep Dive.
Focused Investment Thesis
Main drivers of the Bull Case
Valuation Model
To see what you can expect, read my Oscar Health Investment Case!
Earnings Reviews and Updates – For companies that are of great interest to me and my readers, I will provide regular quarterly or semi-annual updates after earnings reports.
Financial performance
Business Update
New developments
Updated Valuation Model
To see what you can expect, read my Google Q2 2025 Earnings Review!
Equity Research Report List
You can follow me on Social Media below:
X(Twitter): TheRayMyers
Threads: @global_equity_briefing
LinkedIn: TheRayMyers
Disclaimer: Global Equity Briefing by Ray Myers
The information provided in the “Global Equity Briefing” newsletter is for informational purposes only and does not constitute financial advice, investment recommendations, or an offer or solicitation to buy or sell any securities. Ray Myers, as the author, is not a registered financial advisor, and readers should consult with their own financial advisors before making any investment decisions.
The content presented in this newsletter is based on publicly available information and sources believed to be reliable. However, Ray Myers does not guarantee the accuracy, completeness, or timeliness of the information provided. The author assumes no responsibility or liability for any errors or omissions in the content or for any actions taken in reliance on the information presented.
Readers should be aware that investing involves risks, and past performance is not indicative of future results. The author may or may not hold positions in the companies mentioned in the “Global Equity Briefing” report. Any investment decisions made based on the information in this newsletter are at the sole discretion of the reader, and they assume full responsibility for their own investment activities.