
Dlocal Q1 2026: Missing the Forest for the Trees!
Stock is down 20% in the past month, despite 73% TPV growth and 55% revenue growth.

Welcome to Global Equity Briefing, my weekly investing newsletter.
I am Ray, a passionate investor and equity analyst. And today I am covering Dlocal.
On Thursday, Dlocal released its Q1 2026 results, which showed strong payment volume and top-line growth but weaker profitability.
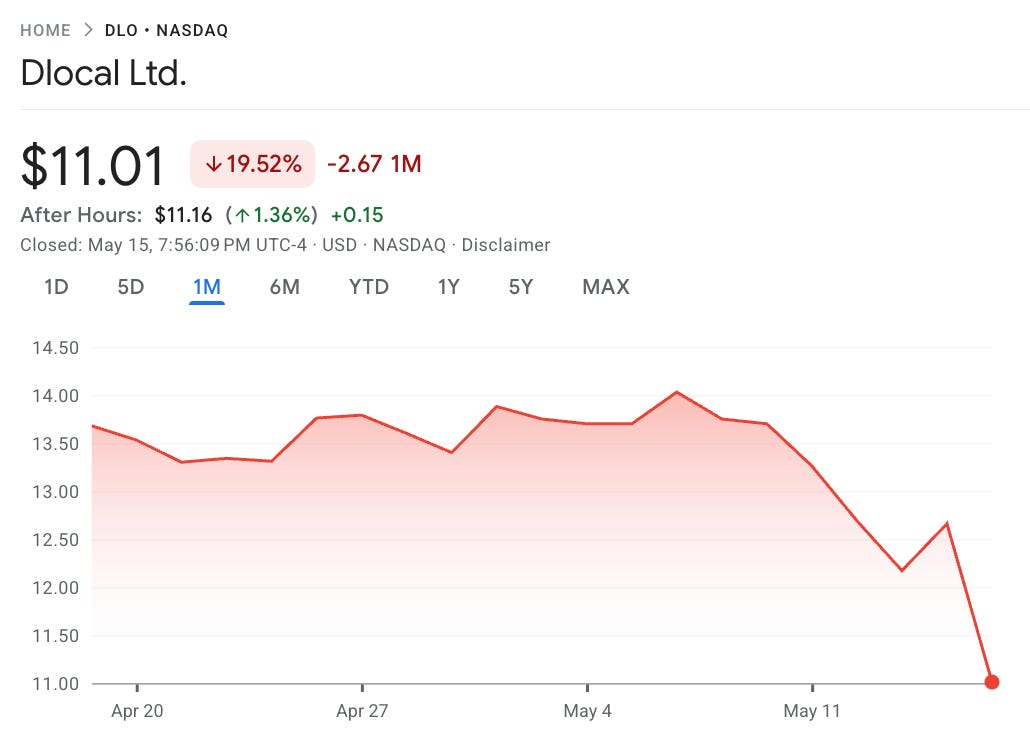
The market continues to pay too much attention to the short term, missing the forest for the trees, as the stock fell 8% and is now down 20% in the past month.
The market had such a negative reaction largely because of two reasons:
1. Missing earnings estimate.
2. Falling take rate.
Analysts forecast that ADJ EBITDA will come at $72M, but came significantly lower at $60.5M.
At the same time, DLocal continues to decrease as the company attracts payment volumes with structurally lower take rates.
Revenue take-rate decreased from 2.67% in Q1 2025 to 2.39% this quarter, while gross profit take-rate decreased from 1.05% in to 0.84%. While certainly a negative development, this is a clear overreaction to a metric that is a bit volatile and ignores the fact that these new volumes are profitable, despite the lower take rate.
In my opinion, the same as with Nu, Dlocal’s stock price is suffering from the FOMO trade.
Sell quality to buy AI stocks!
As a result, Dlocal trades for a FWD P/E of 11, despite strong fundamentals and fast profitable growth.
In this report, I will look at the results of the quarter and build a new valuation model that reflects the upside potential I believe Dlocal has.
Let’s begin.
1. Financial Summary
2. Payment Volumes
3. Take-Rate
4. Retention
5. Valuation
6. Valuation Model
7. Conclusion
1. Financial Summary
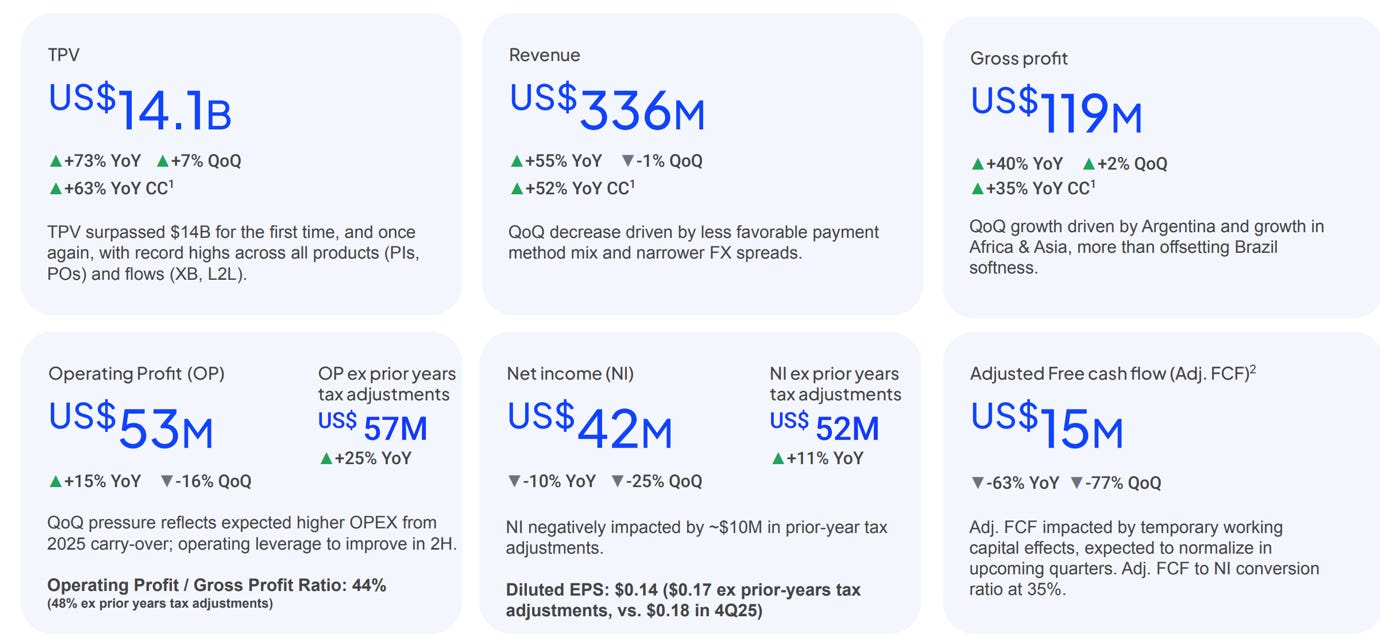
Total Payment Volumes: $14.1B +73% Y/Y, +7% Q/Q.
Revenue: $336M +55% Y/Y, -1% Q/Q. (Estimate of $331M)
Gross profit: $119M +40% Y/Y, +2% Q/Q.
Operating profit: $53M +15% Y/Y, -16% Q/Q. (Estimate of $57M)
Net Income: $42M -10% Y/Y, -25% Q/Q.
EPS: $0.14, -10% Y/Y, -23% Q/Q, (Estimate of $0.17)
ADJ FCF: $15M, -63% Y/Y, -77% Q/Q.
Dlocal delivered very strong top-line results, beating analyst expectations by $5M, around 1.5%.
And while analysts focus on the falling take rate, they completely ignore the operating leverage that is being built in the business!
While operating profit declined 16% Q/Q, it was because of a one-time $9.7M tax adjustments that relate to last year, if not for this tax impact, operating profit would have grown by 25% Y/Y, not 15%.
Furthermore, the profitability was also weaker due to Dlocal continuing to invest in the business.
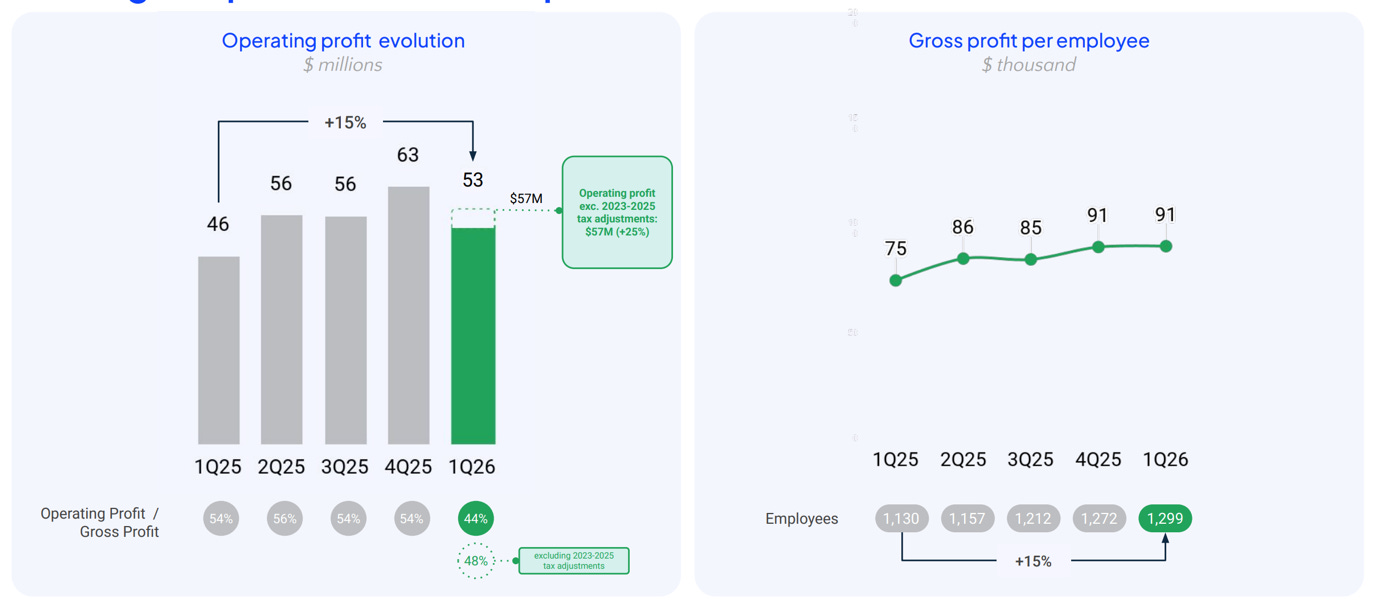
Employee count increased by 15% Y/Y, and this had an impact on opex. The company expects to achieve higher operating leverage in the second half of the year.
Gross profit per employee now sits at $91K, flat compared to Q4 2025, but up 21% from $75K in Q1 2025.
Meanwhile, net income grew 11% Y/Y if ignoring these one-time tax adjustments.
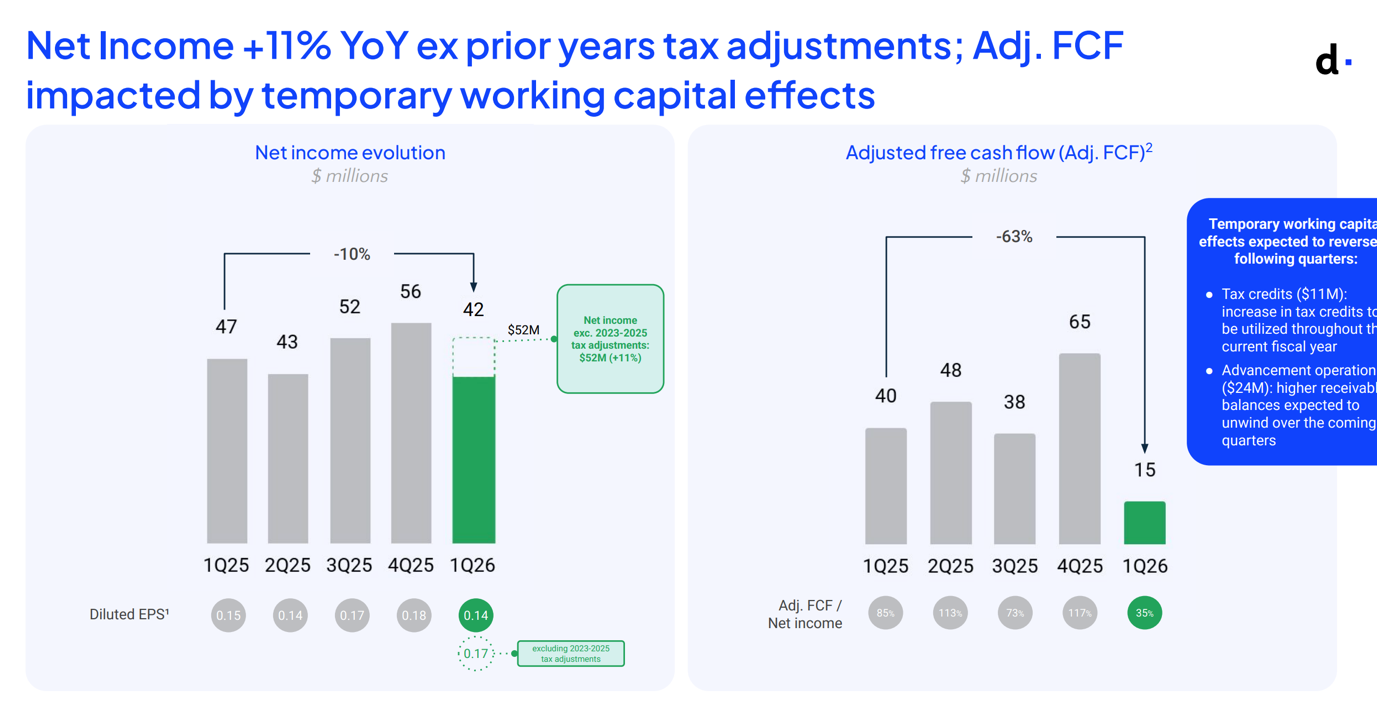
But even without this adjustment, 11% net income growth is quite weak.
This is due to Dlocal being in a strong investment period, with operating expenses growing by 58% Y/Y to $66M. You would expect a scalable, high-quality tech business to grow operating expenses slower than revenues and gross profit.
That is not the case now, as Dlocal invests to build new products for its customers and grow in Asia and Africa.
This is also what contributed to the sell-off, as investors do not seem to believe the management when they promise lower operating expense growth and higher profits in the second half of the year.
1.1. Guidance
Dlocal left its 2026 guidance unchanged!
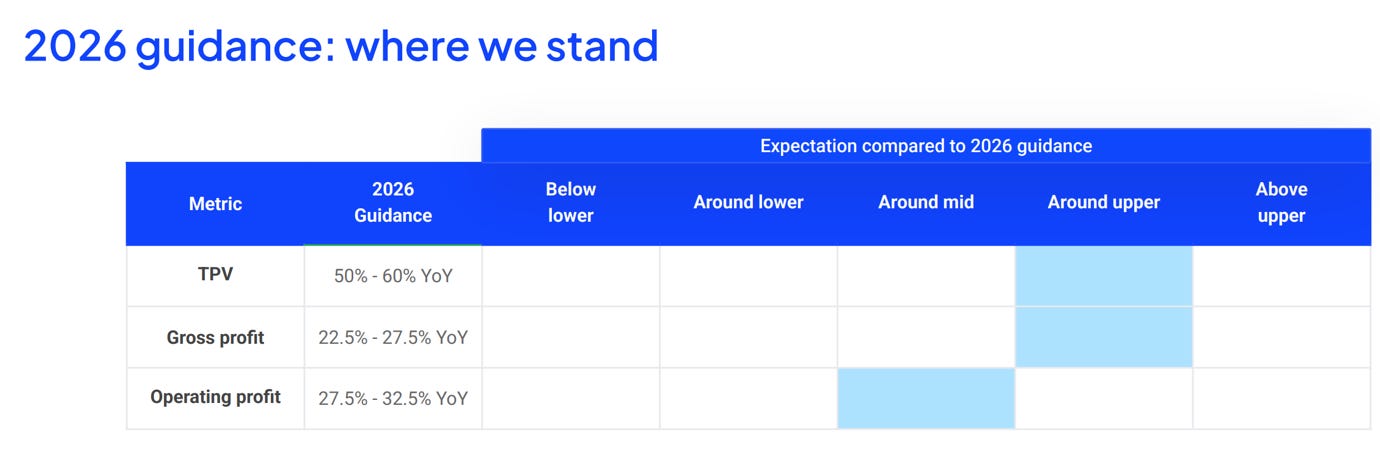
The company expects 50-60% TPV growth, 22.5-27.5% gross profit growth, and 27.5-32.5%
In this market, not increasing guidance is seen as a miss, so this likely contributed to the sell-off.
2. Payment Volumes
For a payments fintech, payment volumes are the most important metric that investors must track. Simply put, the more money that goes through Dlocal’s rails, the more money the company keeps for itself.
In Q1 2026, Dlocal grew payment volumes by an exceptionally strong 73.4% Y/Y, reaching $14.1B!

As we can see in the graph above, it was the best growth rate in a while and the 8th quarter in a row of accelerating payment volume growth.
Furthermore, as we can see in the picture below, payment volumes grew strongly across most of its core verticals!
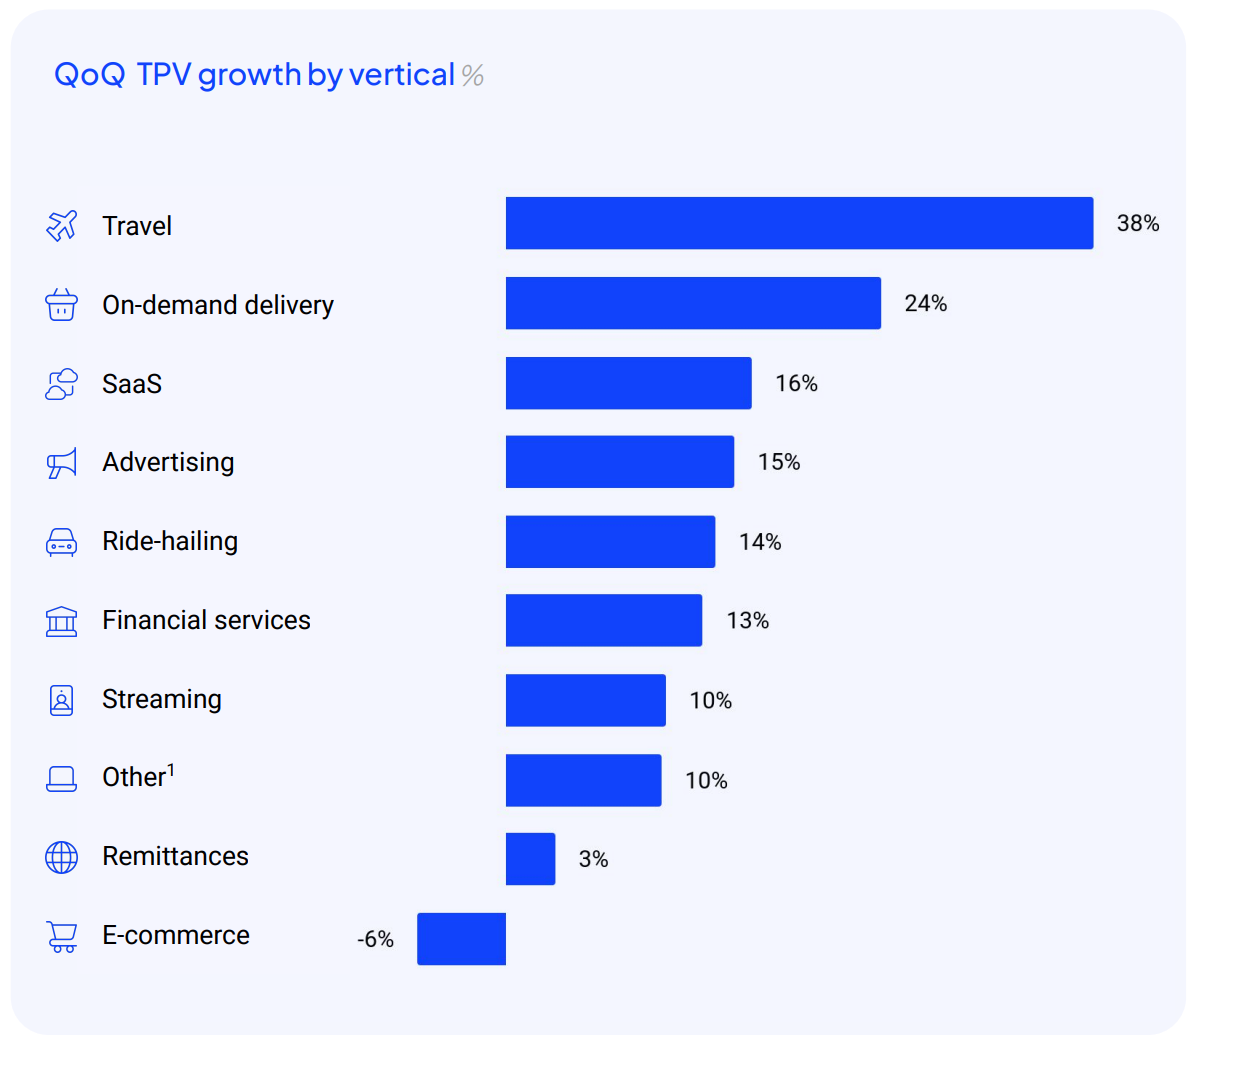
E-commerce, the largest and most important vertical, decreased by 6% Q/Q due to seasonality, as Q4 is always the strongest due to holiday shopping. Comparing Q1 2026 to Q1 2024, we see that this segment has grown by 186% in 2 years.
This is an exceptionally strong growth that demonstrates the potential of this segment. Let’s remember that e-commerce penetration is still lower in emerging markets compared to developed ones, providing Dlocal with a strong opportunity to scale.
Another outstanding performance came from the travel vertical, which grew 38% Q/Q, driven by Dlocal’s many customers, including Booking.com, Trip.com, and Klook.
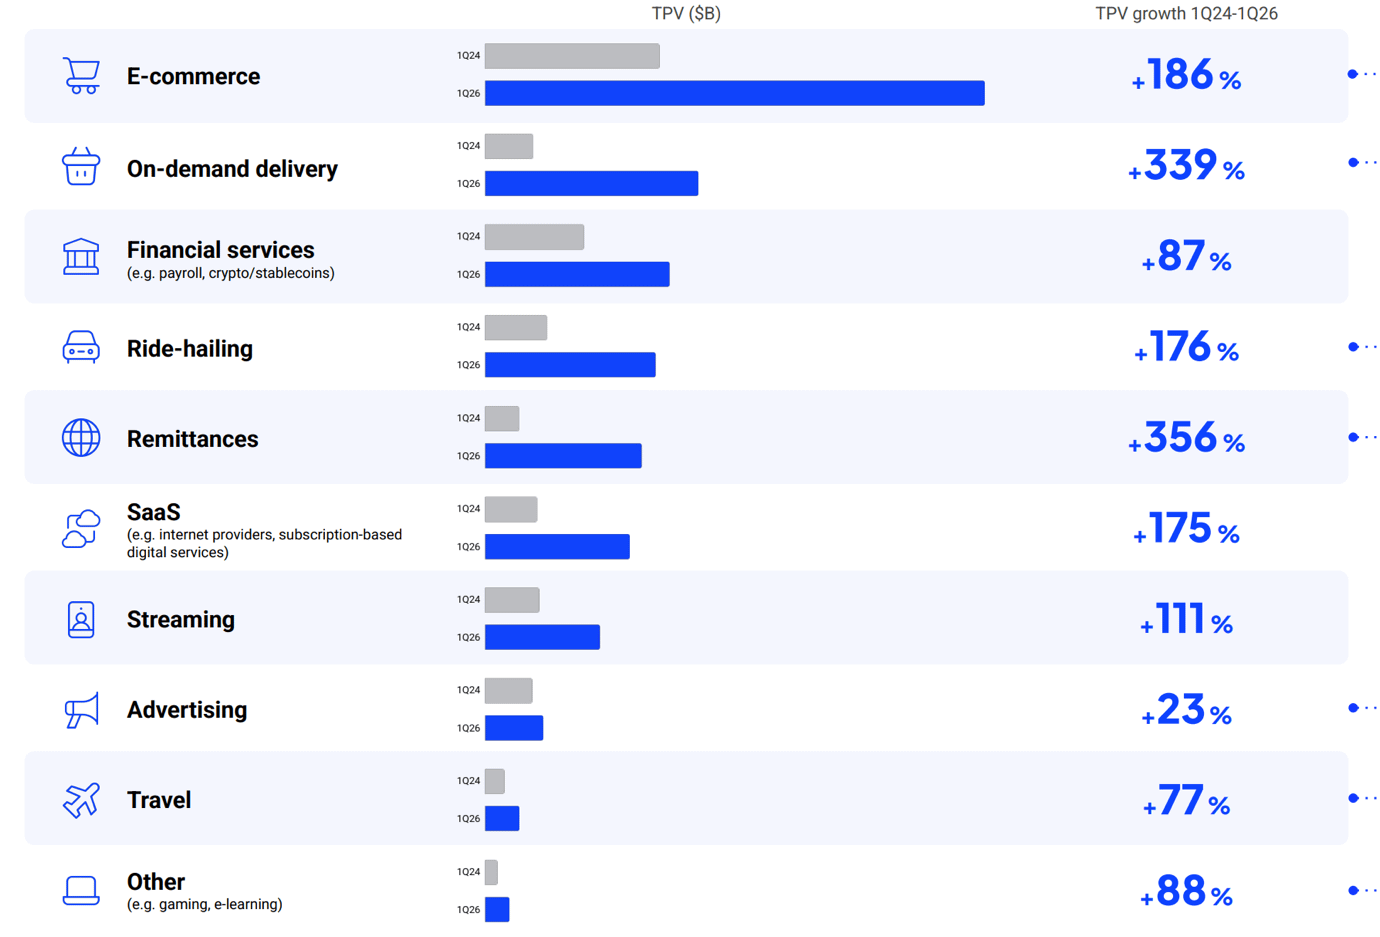
In the above picture, we see 2-year TPV volume growth for key verticals.
All are demonstrating strong growth, except for Advertising.
Growth would have been even better if not for slower growth in Africa and Asia.
Dlocal didn’t disclose the TPV mix per region, but judging by the revenue growth of 36% (vs 55% for total revenue growth), these regions are ramping slower than I would have liked. These regions should grow faster than Latam, as they have a much lower base.
However, despite this slower growth, Pedro Arnt believes there is a huge opportunity in Asia and that he believes Dlocal is still early.
“We think that our strategy and the key success factors that have led us to be very successful in Africa and Latin America actually are applicable to Asia as we cross-sell our growing Asian capabilities to our global merchants.
The second, I think, myth we’ve dispelled is that Asia necessarily was a lower take rate market for the enterprise segment. From what we’re seeing in our current Asian operations as it scales out, that doesn’t seem to be the case either.
I think you will see us increasingly build out capabilities in Asia, and ideally, Asia over a multi-year period becomes quite relevant to our overall P&L.
That really could be trajectory-changing, just because when you look at the size of the total market, Asia still dwarfs LATAM and Africa.
Encouraging initial steps.” Pedro Arnt, Dlocal CEO
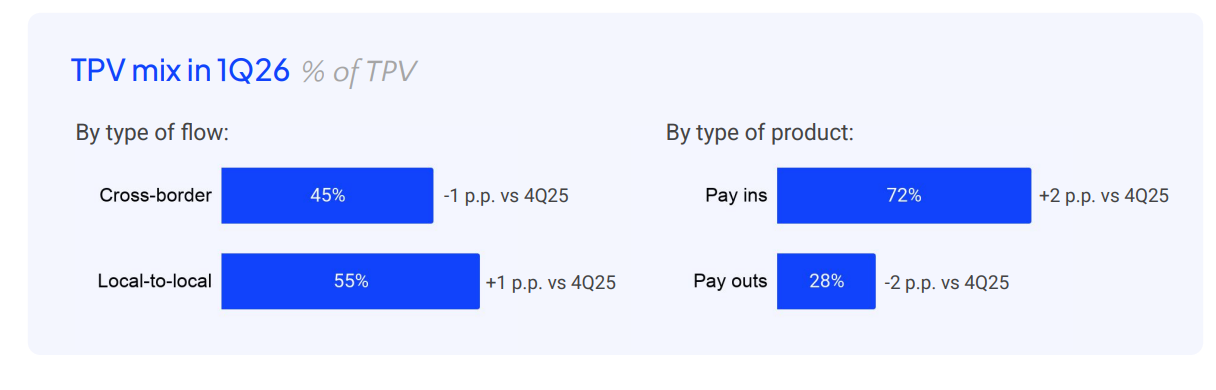
This quarter’s pay-ins grew faster than pay-outs, changing the previous trend of pay-outs having a larger share in the mix.
Pay-outs are now 28% of TPV, a decrease from 30% in Q4 2025 and 33% in Q1 2025. This could be due to the weakness in the remittances vertical, which this quarter only grew 3% Q/Q. Similar to e-commerce, Dlocal explained this by seasonality.
As Dlocal has barely scratched the surface in the remittances vertical, and it is growing strongly in ride-hailing and delivery, the share of pay-outs will likely continue increasing in the future. This will have a negative effect on the take rate. These activities have lower fees, but we will discuss that in the take-rate section.
3. Take-Rate
Dlocal defines its take rate as gross profit divided by total payment volumes.
In Q1 2026, Dlocal reported a take rate of 0.84%, a significant decrease from 0.88% in the prior quarter and 1.05% in Q1 2025!
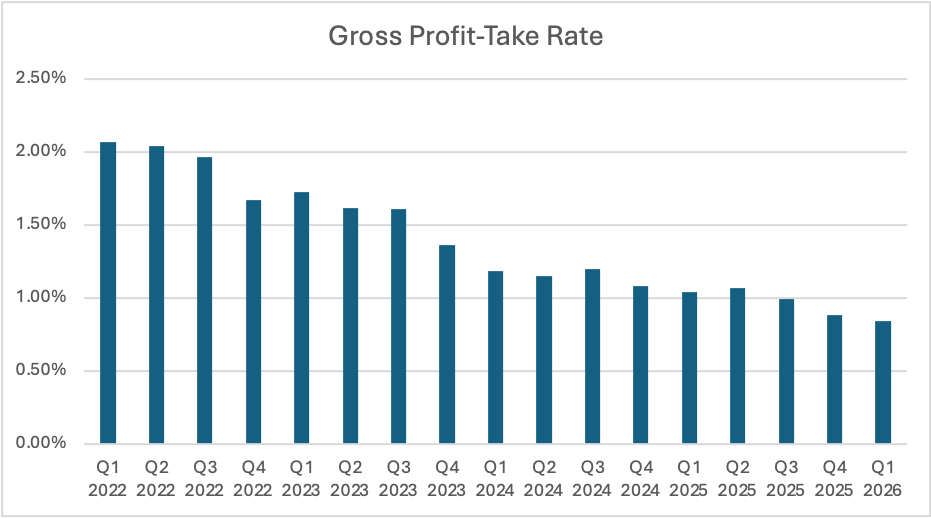
As we can see in the graph above, there is a clear downtrend of falling take rates, with the take rate more than halving in 4 years.
Every quarter, the street panics over the take rate, and this quarter is a perfect example.
The thought process is very simple, if Dlocal keeps less money for itself from every dollar it processes, its growth suffers.
However, this is a very simplistic thinking that ignores all other factors that also drive earnings growth.
Essentially, 3 factors largely determine a take rate, and each of them might have a larger effect in a particular quarter.
First, the financial terms under which the company has agreed to process payments for a merchant. A large customer renegotiating financial terms could have an outsized impact on the take rate.
Second, transaction processing costs. Dlocal operates a payment aggregator business where it handles the front-facing relationship with a merchant, whilst it integrates services from other payment acquirers, merchant banks, FX services, and more. Sometimes they earn higher FX fees, allowing the take rate to increase, whilst at other times the company incurs higher processing costs, reducing the take rate.
Third, payment volume mix shift. Fewer credit cards, more local payment methods, fewer pay-ins, more pay-outs.
Dlocal simplifies the payout processes for e-commerce, ride-hailing, and travel companies. However, these transactions are less complex and usually happen in batches, thus Dlocal charges lower fees to merchants for handling them.
This quarter, we saw a mix of all 3.
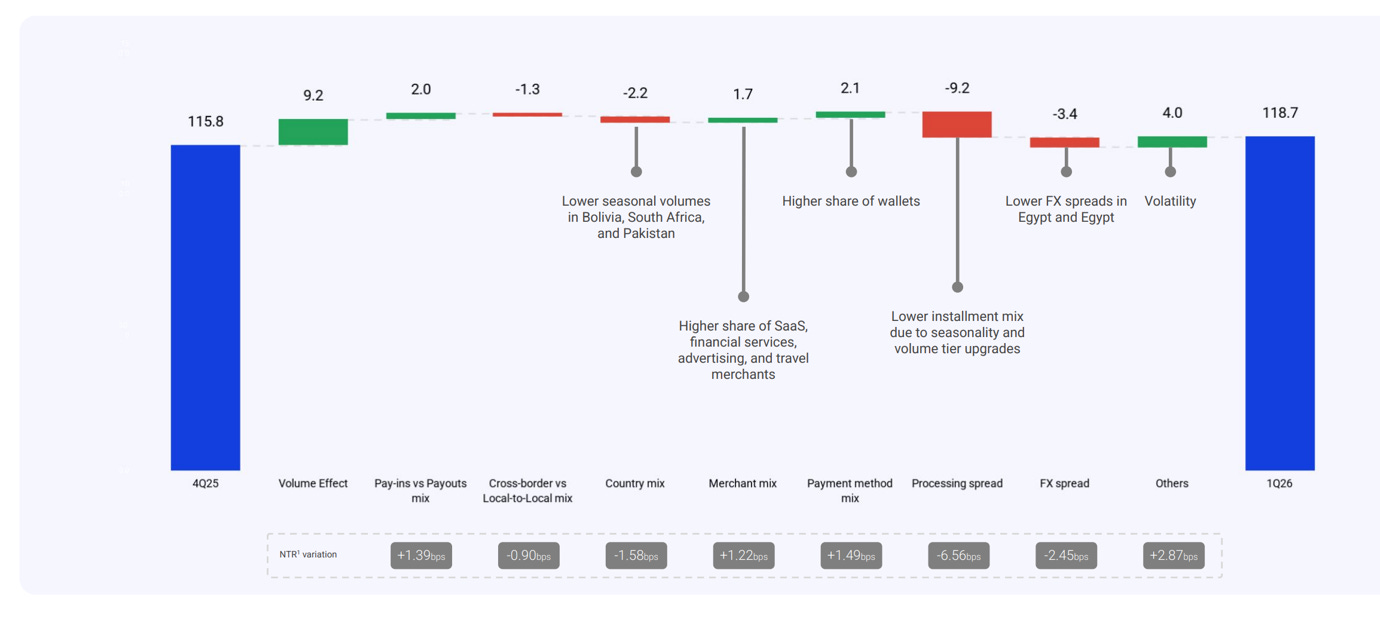
I really love the above chart from Dlocal, where the company easily bridges the difference in take rate from Q4 2025 to Q1 2026, explaining how Dlocal lost 4 basis points in take rate. I would love all payment companies to disclose so much.
As we can see, a 1.39 basis point gain in take rate was due to a larger share of pay-ins. Pay-outs are 28% of TPV, and as their share increases, they will continue putting downward pressure on the take-rate. This is largely due to seasonality, and I expect the share of pay-outs to put more downward pressure on the take-rate in the next few quarters.
Another 1.22 basis point gain came from a higher share of SaaS and other higher take-rate verticals in the TPV mix. 1.49 basis points were gained from processing more transactions with higher take rates, and 2.87 basis points came from other reasons.
This is where take rate gains end, as 0.9 were lost due to a higher share of local vs cross-border payments. Cross-border payments have higher take-rates.
1.58 basis points were lost due to lower volumes in smaller frontier markets that have higher take rates, such as Bolivia, Pakistan, and South Africa. Another 2.45 basis points were lost due to lower FX spreads in Egypt and elsewhere.
However, most of the 4-basis point take rate decline was caused by seasonality and “volume tier upgrades”.
Simply put, Dlocal is likely giving meaningful discounts to its largest merchants, such as Uber, Netflix, and Didi, to retain them and keep driving volume growth. This is a standard strategy in payments, because without such discounts, some merchants would move volumes. It is cheaper to give a large merchant a discount than to lose it and then try to acquire payment volumes from another merchant to replace the lost volumes.
The bigger picture is that payment volumes are growing incredibly quickly across verticals and geographies!
Dlocal might keep a smaller share of each dollar processed because of the nature of and economics of these money flows changes, but that doesn’t matter, as each dollar they process is still quite profitable.

As we can see in the graph above, despite the take rate falling by 66% from 2019 to 2026 (blue line), Dlocal’s EPS grew by 1,000% (purple line).
I know which metric I care about!
4. Retention
Dlocal retention is simply incredible!
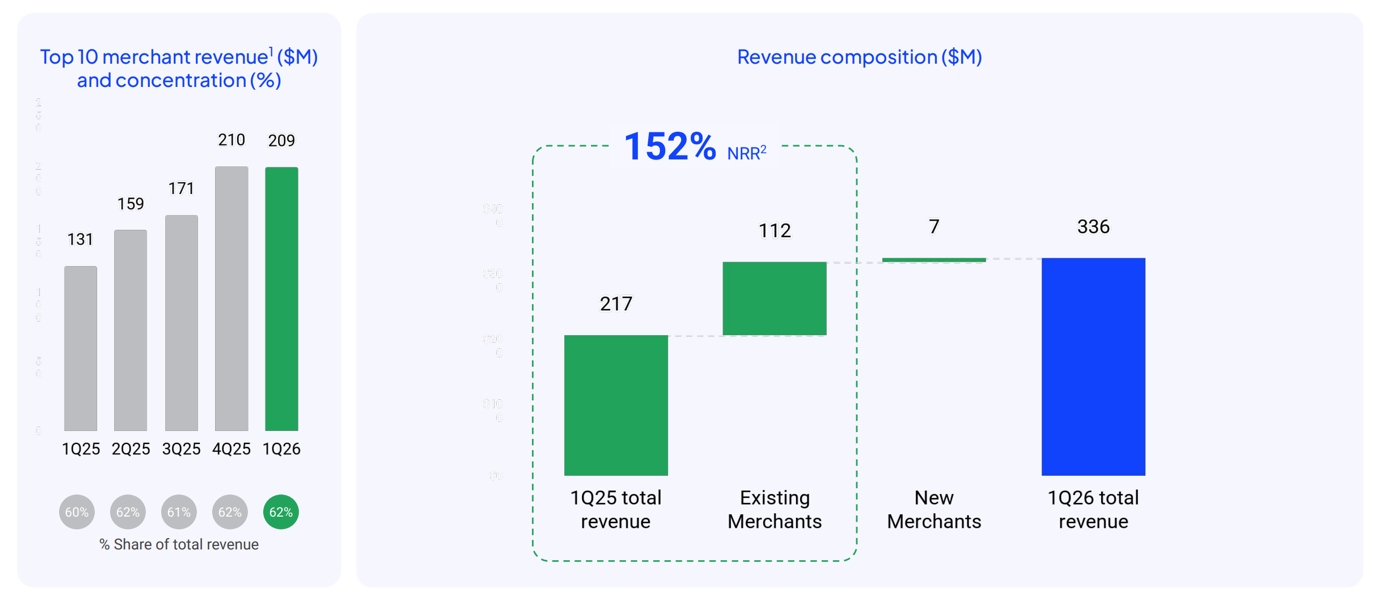
Revenue retention was 152%.
This means that had Dlocal not found new customers, revenue would have grown by 52%. So only 3% of the 55% revenue growth came from new merchants. That is certainly low, but this is because of Dlocal’s land and expansion strategy. In payments, customers always try out processing providers in a few use cases before giving the processor more volume.
The revenue share of the top 10 merchants has remained at around 62%. This means that despite strong revenue growth, other non-top 10 merchants grow fast enough for the concentration not to increase.
So, despite strong growth by the top merchants, concentration is not increasing!
This quarter, they didn’t disclose TPV retention, but it must be even higher, likely at 170%. This is due to falling take-rates.
Here are a few examples from Dlocal’s presentation that demonstrate why the retention is so high.
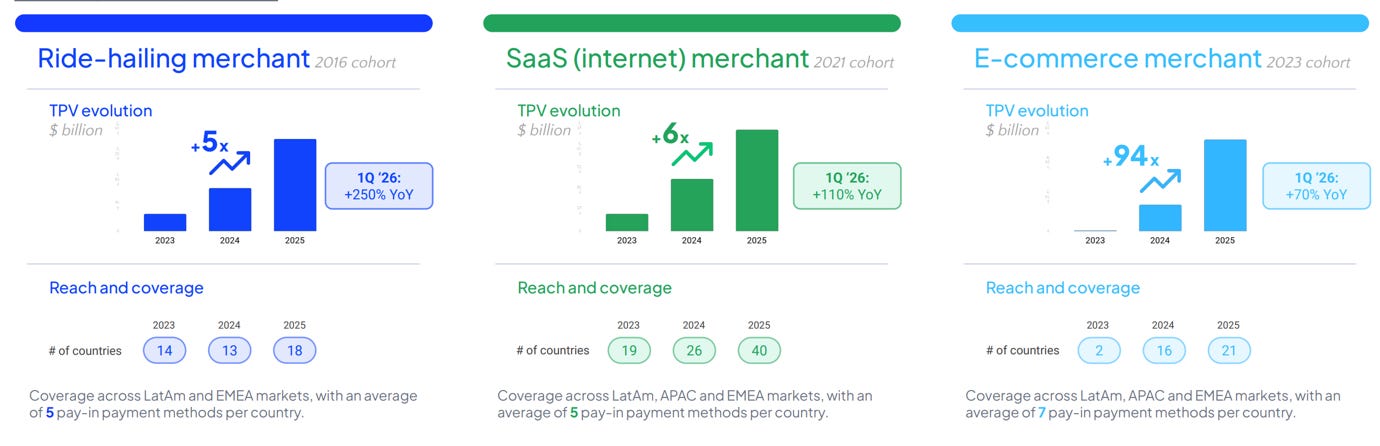
A ride-hailing merchant (likely Uber or Didi) that was acquired in 2016, went from a single country in 2016 to 14 in 2023 and 18 in 2025. TPV is up 5x in 3 years, and Q1 2026 volumes grew 250% Y/Y.
A SaaS merchant went from a single country in 2019 to 19 in 2030 to 40 in 2025, with TPV growing by 6x in 3 years and 110% in Q1 2026.
An e-commerce merchant went from a single country in 2023 to 16 in 2024 and 21 in 2025, with TPV growing by 94x in 3 years and 70% in Q1 2026.
Overall, there is a clear trend of accelerated growth, with newer cohorts expanding faster than earlier ones.
5. Valuation
As a result of Dlocal falling 20% in the past month, it now has a market cap of $3.3B.
I see a clear disconnect between the strong execution and the stock price!
The company now trades for a TTM P/E of 17, which is just an unbelievable entry point for such a strong growth company.
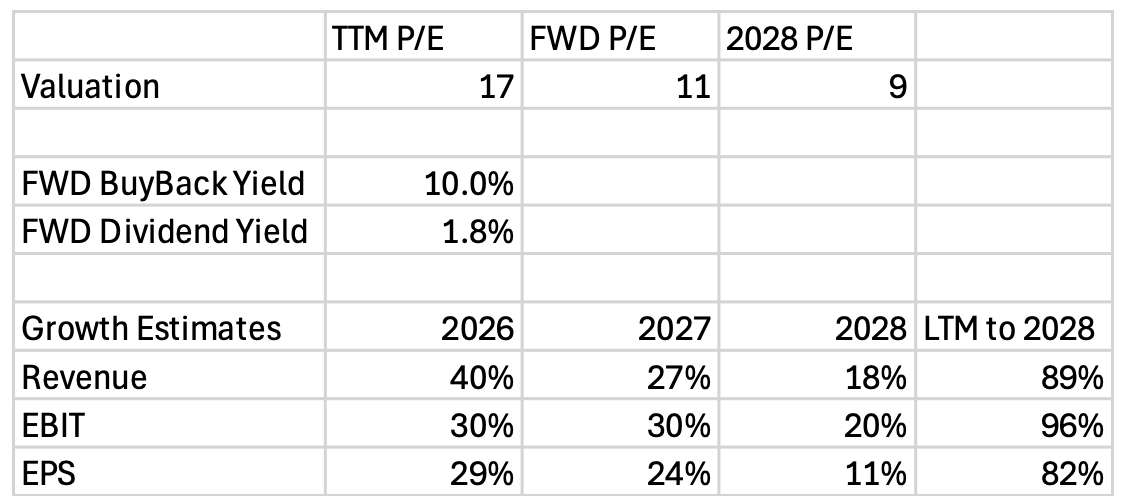
Analysts expect Dlocal to grow revenues by 40% and 27% in 2026 and 2027, leading to revenues being 89% higher in 2028 than in the last 12 months.
But most importantly, they expect Dlocal to meaningfully improve profitability, with EBIT growing 96% by 2028, and EPS 82%.
Furthermore, the company has a shareholder return plan, with about $300M to be spent on share repurchases, reducing share count by potentially 10%. Additionally, the company pays a dividend, which could end up being about 1.8% dividend yield.
Taking analyst growth expectations into account, the 2028 P/E is just 9.
Simply put, even if the multiple remains the same as it is today, Dlocal stock should increase by 82% in the next 2 and a half years!
However, I find analyst estimates to be on the low side, and there is a potential for the multiple to increase.
Let’s model that.
6. Valuation Model
Since I made the previous Dlocal valuation model back in November, I have increased my confidence in the business, thus, I will upgrade my assumptions.
First, with the pace of innovation continuing and Dlocal signing new partnerships continuously, I have increased my 2030 TPV estimate from $131B to $178B!
Due to the take rate performance of this quarter, I have reduced my revenue take rate to 1.9%. That would be a decrease of 30% from the 2.7% revenue take rate of Q3 2025.
That would lead to revenues of $3.3B in 2030, an increase from $2.6B in the previous model!
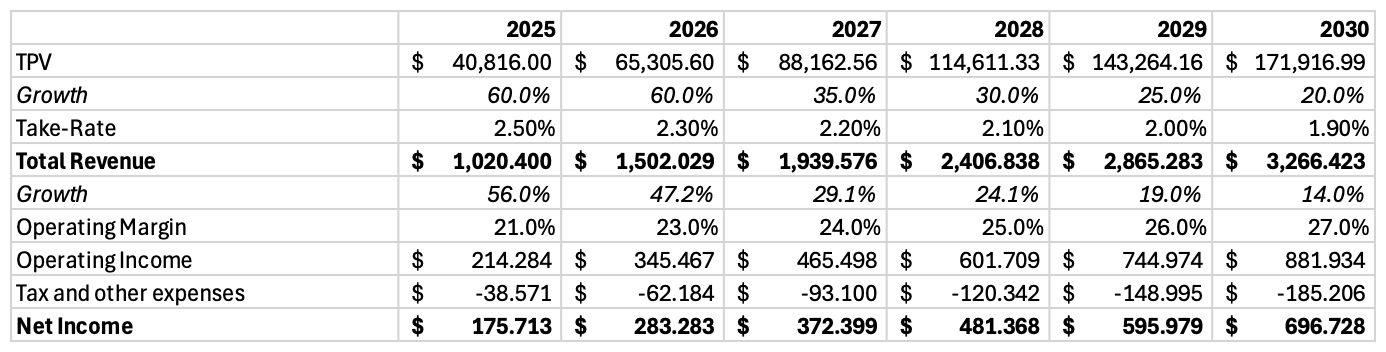
Next, I model the operating margin increasing from around 21% the company has today to 27% in 2030.
Tax and other expenses of 21%.
The result of these assumptions is a net income $697M, an increase from $561M in the previous model.
Buyback of 15% over the next 5 years.
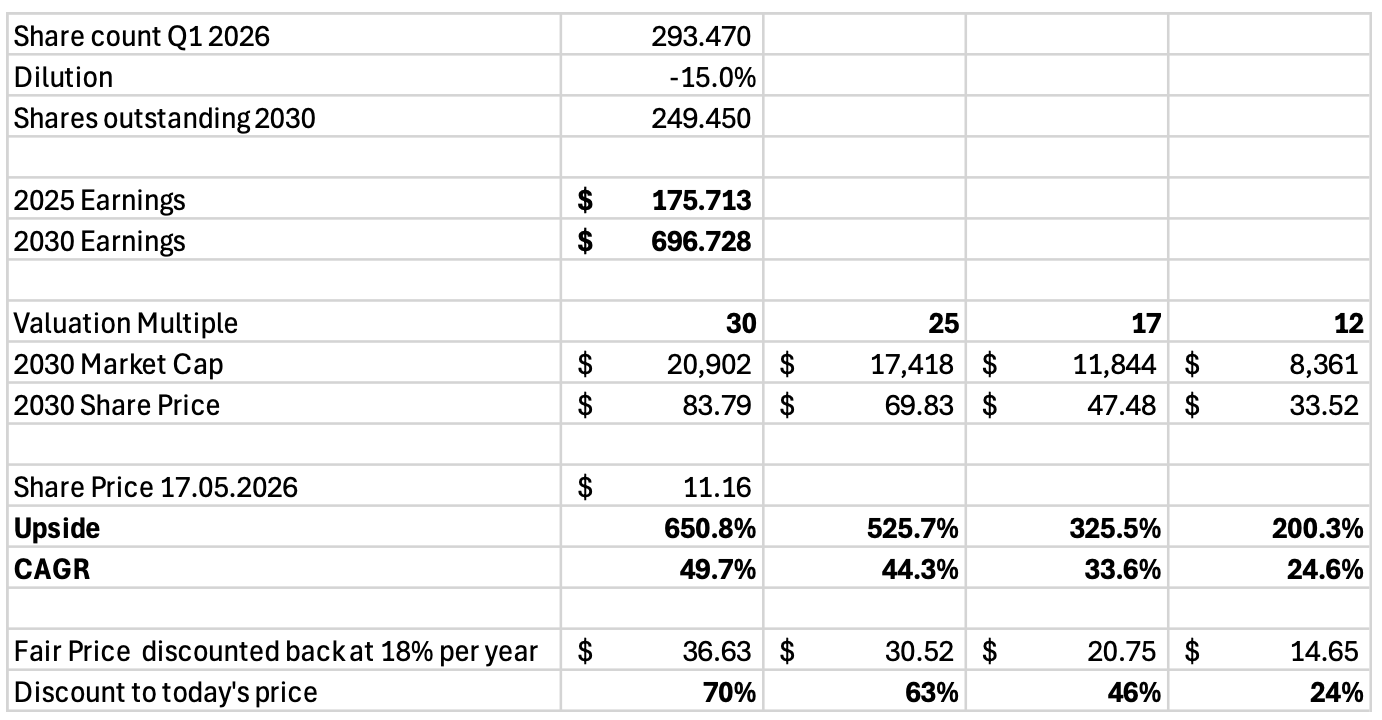
With an exit multiple of 17, we get a $47.48 stock, an upside of 325% from today!
Discounting that back at 18% per year, we get a fair value per share of $20.75, implying that today’s price of $11.16 is 46% below fair value.
However, if the market assigns the company a better multiple of 25-30, the upside increases to 525-651%!
Dlocal is a clear opportunity that is underappreciated by the Mr. Market, but with time, strong execution will force Mr. Market to appreciate it.
7. Conclusion
The long-term thesis for DLocal is still extremely favorable.
The company is uniquely positioned to benefit from the digitization of emerging markets, driving massive adoption of digital services.
E-commerce, streaming services, ride-hailing, food delivery, SaaS, travel, and financial services are undergoing a once-in-a-generation shift!
With its comprehensive and improving platform, DLocal is taking an increasing slice of the emerging markets digital payments pie.
Thanks to the quality of their services, DLocal has built strong relationships with some of the world’s largest and fastest-growing digital companies. Just by servicing the likes of Amazon, Meta, and Google well and upselling new products, DLocal can grow immensely.
The current short-term take-rate concerns are overblown, and Dlocal is well-positioned to have a strong, thriving, and highly profitable business.
Dlocal has built a capital-light, high-margin business that trades for a reasonable valuation.
As the valuation model shows, with reasonable assumptions, investors could see 325% upside by 2030!
With more aggressive assumptions, investors could even experience 7x returns by 2030.
Furthermore, Dlocal’s share price has suffered from the FOMO trade, with investors selling high-quality assets to buy speculative AI stocks.
I don’t believe that this is a profitable trade. Selling quality companies at such depressed levels to buy hype stocks is a recipe for disaster.
I believe that this trade will end soon, as fintechs such as Nu, DLocal, Klarna, and Sofi are trading at unsustainably low valuations.
Companies with strong balance sheets, increasing TAM, and 30-40% topline growth don’t deserve to trade for sub-20 FWD P/E. Dlocal trading for a FWD P/E of 11, despite such strong growth and quality characteristics, is objectively unbelievable.
Eventually, the market will return to wanting profits, as it did in 2022 after the 2021 EV/SaaS bubble burst.

Here is what my Premium Members can expect:
Portfolio Review - Each month, I will present the portfolio performance and discuss my stock watchlist and my best ideas.
Recent developments.
Unwarranted pullbacks.
Insider activity.
Potential catalysts.
Deep Dives – 8,000+ word detailed analysis of a company, delivered in 3 Parts.
Part 1 – Brief History of the company and its Business Model.
Part 2 – Management, Moats, Competitors, and Risks.
Part 3 – Opportunities, Financial Analysis, and a Valuation Model.
You can expect a comprehensive research report that is educational, interesting, and provides actionable insights!
To see what you can expect, read my Palantir Deep Dive!
Members of the Premium service get access to my library of 12 Deep Dives and to all future Deep Dives, which will be released on semi-monthly basis.
Investment Cases – A short, concise report with actionable insights.
This report is about the size of a single part of a Deep Dive.
Focused Investment Thesis
Main drivers of the Bull Case
Valuation Model
To see what you can expect, read my Oscar Health Investment Case!
Earnings Reviews and Updates – For companies that are of great interest to me and my readers, I will provide regular quarterly or semi-annual updates after earnings reports.
Financial performance
Business Update
New developments
Updated Valuation Model
To see what you can expect, read my Google Q2 2025 Earnings Review!
Equity Research Report List
You can follow me on Social Media below:
X(Twitter): TheRayMyers
Threads: @global_equity_briefing
LinkedIn: TheRayMyers
Disclaimer: Global Equity Briefing by Ray Myers
The information provided in the “Global Equity Briefing” newsletter is for informational purposes only and does not constitute financial advice, investment recommendations, or an offer or solicitation to buy or sell any securities. Ray Myers, as the author, is not a registered financial advisor, and readers should consult with their own financial advisors before making any investment decisions.
The content presented in this newsletter is based on publicly available information and sources believed to be reliable. However, Ray Myers does not guarantee the accuracy, completeness, or timeliness of the information provided. The author assumes no responsibility or liability for any errors or omissions in the content or for any actions taken in reliance on the information presented.
Readers should be aware that investing involves risks, and past performance is not indicative of future results. The author may or may not hold positions in the companies mentioned in the “Global Equity Briefing” report. Any investment decisions made based on the information in this newsletter are at the sole discretion of the reader, and they assume full responsibility for their own investment activities.