
Nu Q1 2026: Incredible Growth vs AI Hungry Market!
Stock is down 21% in the past month, despite 53% revenue growth and 56% net income growth.

Welcome to Global Equity Briefing, my weekly investing newsletter.
I am Ray, a passionate investor and equity analyst. And today I am covering Nu.
On Thursday, Nu Holdings reported earnings, and they were again excellent!
Yet the market continues to focus on short-term narratives instead of fundamentals and long-term execution.
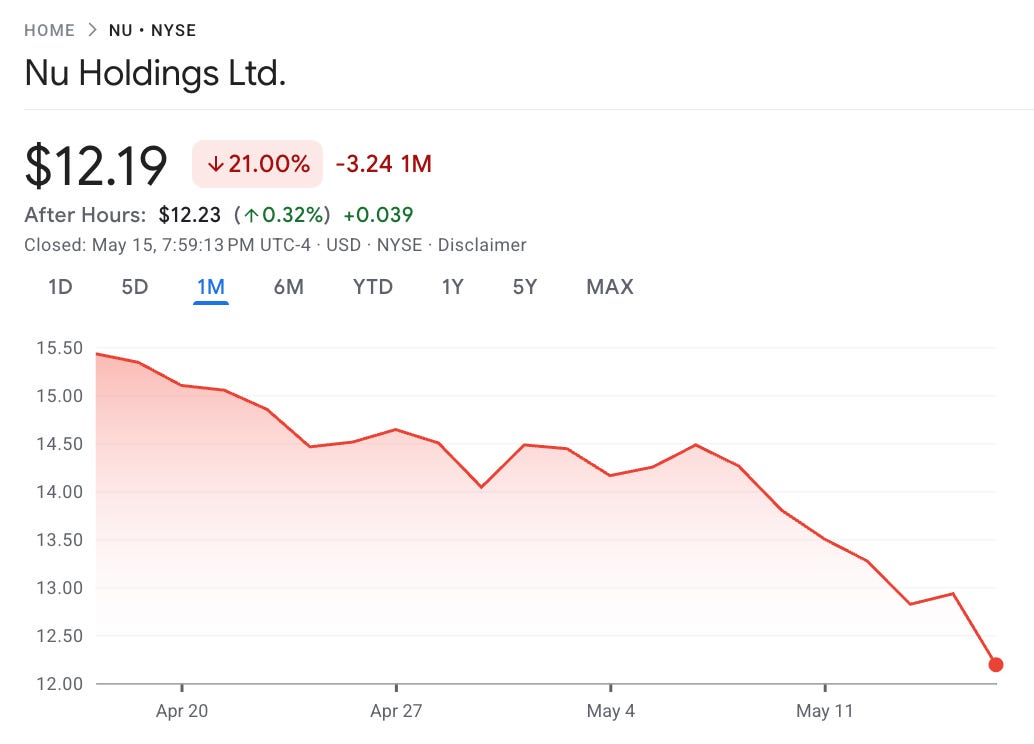
Nu’s stock is now down 21% over the past month, despite accelerating revenue growth, strong profitability, and the prospects of US and global expansion.
It is clear that we are witnessing a FOMO trade in real time.
Sell quality to buy AI stocks!
As a result, Nu trades at just 14x FWD P/E.
I find this valuation to be extremely attractive for long-term-minded investors, especially considering Nu posted such strong financial results:
Total revenues $5B +53%
Net income $872M +56.5%
EPS $0.18+ 63.6%, slightly missing analyst estimate of $0.19
ARPU $15.9 +42%
Cost per ARPU increased from $0.7 to $1 Y/Y.
The total number of customers increased by 4.2M to 135.2M, +14%
Let’s look at the quarter in more detail to see what Wall Street liked and what they didn’t.
1. Customer Level Results
2. Brazil
3. Mexico
4. Colombia
5. Deposits and Loan Portfolio
6. Revenue
7. Profitability
8. Conclusion

1. Customer Level Results
Nu continues to gain customers at an incredible pace.
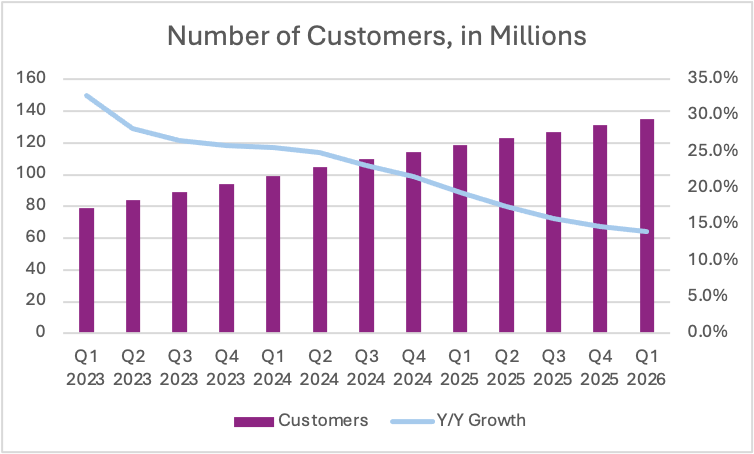
The number of customers grew by 14% Y/Y and 3.2% Q/Q to 136.2M, an increase of 4.2M over Q4 2025!
In the above graph you can see how the growth has decreased significantly in the 2 years, this is understandable. You can’t grow customers at 30% per year once you already have over 130M customers.
However, interestingly, the growth rate has plateaued in the last few quarters and appears not to be decreasing as fast as some expected. Simply put, Nu continues to acquire new customers, as the total addressable market is vast.
Moreover, 83% of these customers are monthly active customers, the same as last year. In fact, the activity rate has remained unchanged for 4 years, which is remarkable given the rapid growth.
One could expect a slight decrease in activity rate after expanding into two new countries and adding tens of millions of new customers.

Above we see Nu’s share of adult populations in its core markets as of Q4 2025. They didn’t include such a slide this quarter, but it is clear that these ratios have only increased.
62% of Adults in Brazil.
15% in Mexico.
11% in Colombia.
Overall, each active customer generated $15.9 monthly ARPU in Q1, an increase of 42% Y/Y, and 6% Q/Q!
This is incredible growth.
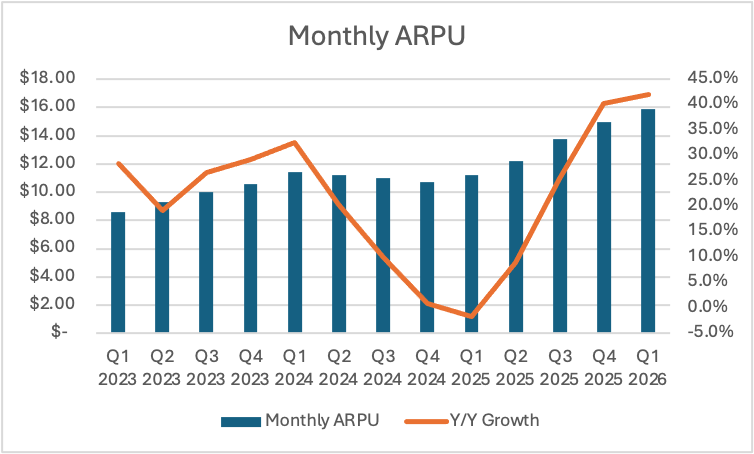
In the graph above, we can see a strong acceleration from Q1 2025, when the company posted a decrease in ARPU by 1.8%. This fall in ARPU caused quite a lot of panic in the Nu investor base, as ARPU growth is a key bull thesis for the company.
This was largely driven by Nu gaining a lot of new, and temporarily under-monetized customers in Mexico and Colombia!
This is what I said last year during the Q1 2025 review:
“As Nu develops Mexico and Colombia, ARPU is likely to increase later in the year, especially as Nu releases new products in Mexico after receiving a full banking license. “ Global Equity Briefing
This quarter, we saw the continuation of that trend as significant growth in both countries directly contributed to the recovery of the ARPU.
On an FX-neutral basis, ARPU actually grew 24% Y/Y, so the company benefited from a weaker USD.
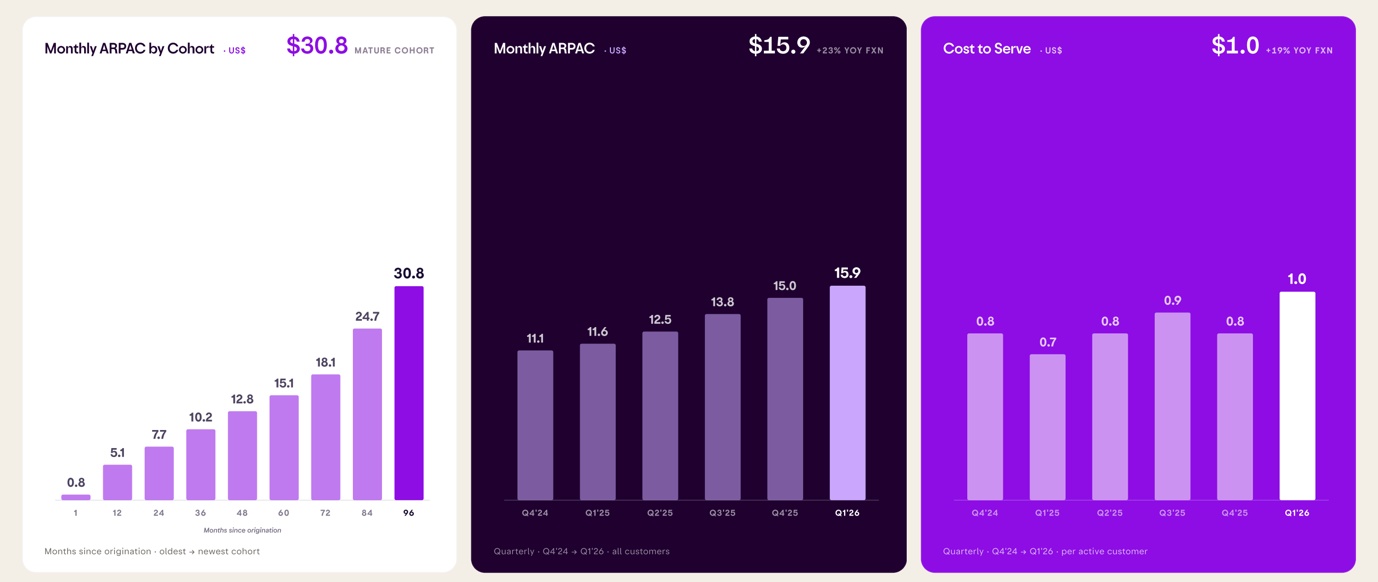
Per the above graph, it takes Nu between 60-72 months to get a new customer to the $15.9 ARPU.
Understanding customer cohorts is incredibly important for Nu investors.
A customer who’s been with Nu for 8 years generates $30.8 in monthly revenues, which is double the average Nu customer, 6x the 1-year-old customer, and 4x the 2-year-old customer.
This is because Nu is very good at upselling customers new products.
A customer goes from using a bank account and a debit card in the first year, to a credit card, savings account, children’s account, investment account, insurance, and a personal loan in year 6.
In the last 3 years, Nu acquired 60M customers that are on average using a few products and generating ARPU of below $10, likely the average is around $6. In the next 5 years, this cohort will get millions of credit cards, put billions in the investment accounts, and borrow billions.
So, doing some back-of-the-napkin math, we get 60M people going from $6 ARPU to $30.8 in 5 years, that’s $17.9B in additional revenue.
That’s about what Nu made in the last 4 quarters. So just by upselling this cohort of users’ existing products, Nu can double its revenues in the next 5 years. We are not even talking about increasing revenues of year 5-8 cohorts, about releasing new products, entering new countries, or acquiring users in existing countries.
This company has incredible opportunities for growth!
Meanwhile, the cost to serve an active customer increased by 42.8% Y/Y, 19% on FXN basis. I will expand in the profitability section on the causes, but in short, Nu is investing and preparing for the next leg of growth.
Despite this increase, if we compare the cost to serve an active customer to ARPU, we see that after about 2 months, a customer is already at break-even in servicing costs!
If we assume a linear growth in ARPU from month 1 to 12, in the first year, an active customer will generate Nu $35.40 in revenue, but it would cost only $12 to service.
This leaves a lot of room for Nu to utilize marketing as organic customer growth slows down when they begin reaching maturity in certain markets.
There is significant potential to increase ARPU.
“I think a couple of our opportunities really on the revenue side, and as a reminder, our ARPAC is $15 today and our incumbent competitors are something like 40, so we have a significant opportunity to increase ARPAC, is around new cross-sale and new products that we can be delivering to the very significant consumer base that we have. I think everything around cross-sale, everything about using the data that we already have to offer new products and services, it’s a big opportunity, and AI is an enabler.” David Velez Nu Q4 2025 Earnings Call
2. Brazil
Brazil, as Nu’s home and Latin America’s largest country by population and GDP, remains the most important market today.
As of Q1 2026, Nu has around 115.5M customers in Brazil, an increase of 10.4% Y/Y.
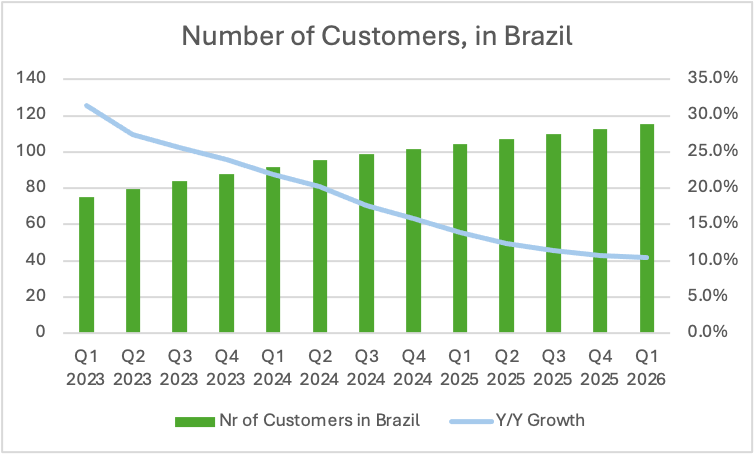
This quarter, Nu added 2.8M customers, an increase of 200K from the 2.6M it added in Q4 2025.
It is quite remarkable that they can add so many customers in a quarter, despite already having 62% of the adult population as customers.
At such a scale, it is becoming harder and harder to acquire new customers, as realistically, it would be crazy if the share of the adult population surpassed 70%. For a single bank to have 70% of the country as customers would be insane.
Thus, it is quite clear that the focus in the future will shift from user growth to user monetization.
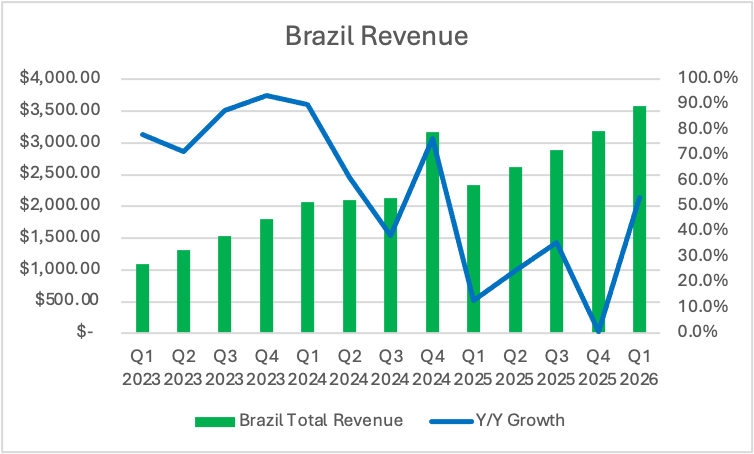
Total revenue in Brazil grew 53.3% Y/Y, to $3.6B!
Please note that total revenue doesn’t match the sum of the geographic revenue, as some of the corporate HQ revenue is not allocated to a specific geography.
Unfortunately, as in the last quarter, Nu did not disclose detailed loan origination statistics for Brazil. My guess is that since expansion in Mexico and Colombia is going steadily, the company wants to emphasize its business as a portfolio of loans, rather than just Brazil.
However, they did disclose Brazil’s lending unit economics!
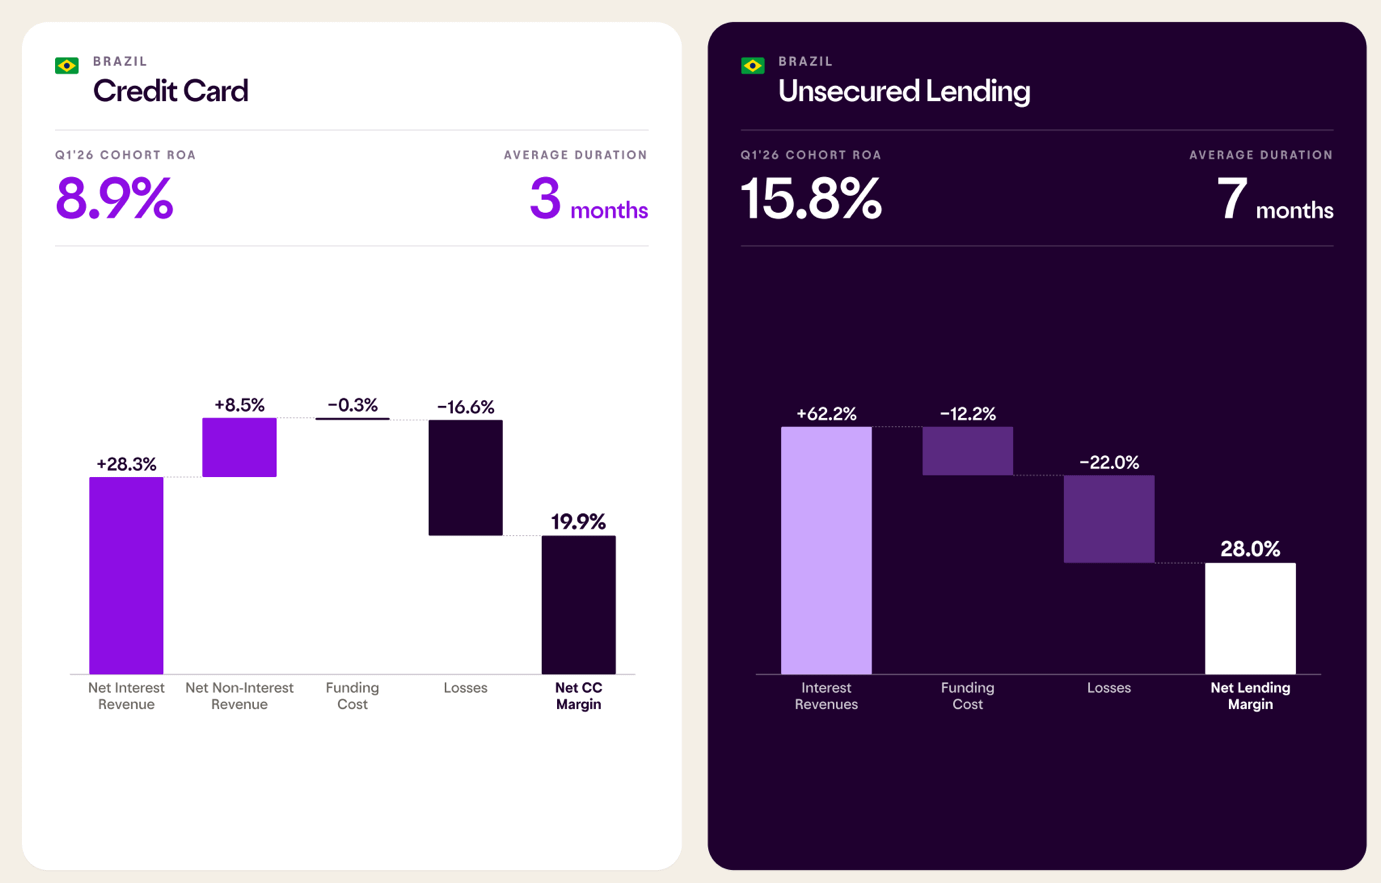
Brazil’s credit card portfolio achieved a return on assets of 8.9%. For context, global bank credit card portfolios generally have an ROA of 3-5% and Brazil’s 8-14%, making Nu’s 8.9% a really strong result.
Because the average duration is so low, just 3 months, Nu can turn over capital 4 times in a year. This enables Nu to generate 28.3% in net interest revenue, and 8.5% in fee and transaction revenue, for a total credit card margin of 36.8%. Accounting for funding costs and losses, we get to a net credit card margin of 19.9%.
Meanwhile, the unsecured lending portfolio generated a return on assets of 15.8%.
Nu was able to generate a 62.2% interest revenues, and after taking into account 12.2% in funding costs and 22% in losses, it had a net lending margin of 28%.
For anyone familiar with US or European interest rates, such returns seem absurd, but that is normal in Brazil, as the country deals with chronically high interest rates.
The Banco Central do Brasil’s interest rate is now at 14.5% compared to 2.15% in the EU and 3.75% in the US.
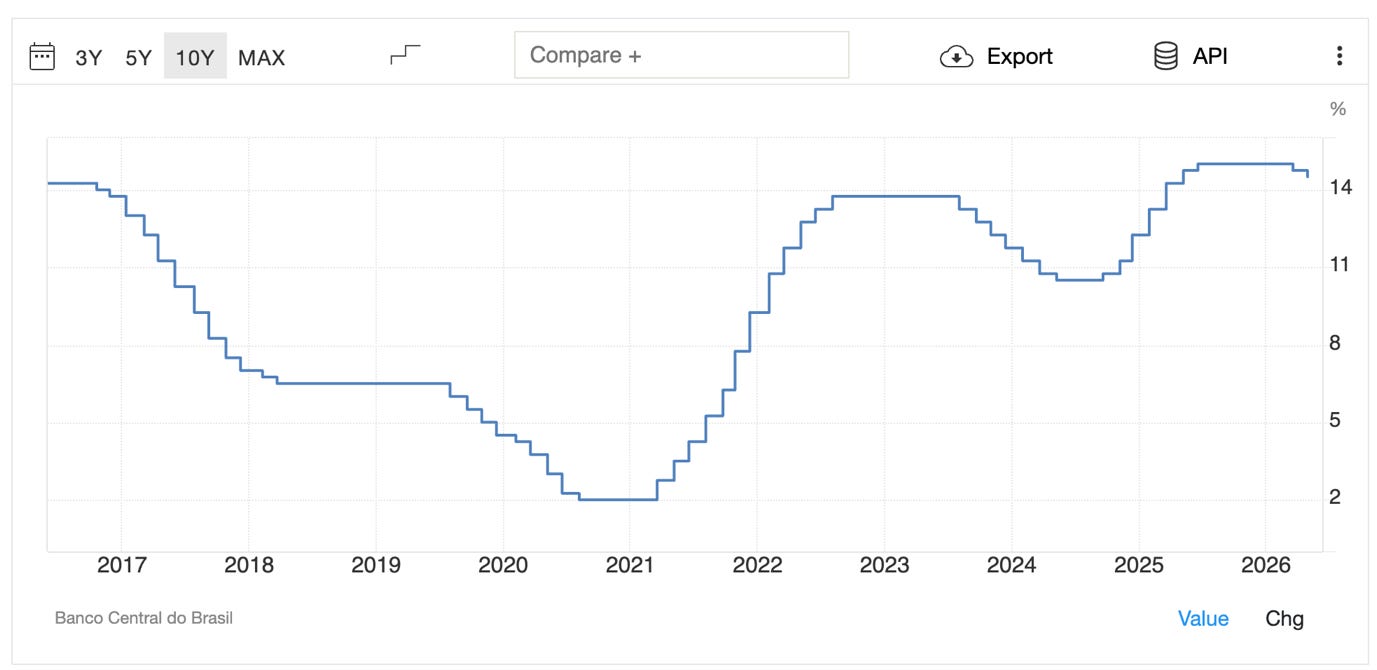
As you can see in the chart above, Brazil’s central bank rate has been above 8% for more than 4 years now.
When your asset yields are so high that you can absorb 16.6% credit card losses and 22.0% lending losses and still walk away with an 8.9% and 15.8% ROA, you are operating a highly resilient lending machine. Competitors globally simply do not have the spread environment, nor do domestic incumbents have the low cost-to-serve, to match these specific cohort returns.
This is also a key bear case for Nu: “What if interest rates go down, reducing lending spreads?”
Look at the chart above, from 2019 to 2022, interest rates were low, and Nu thrived, and they will thrive if that happens again.
Here is what will happen if interest rates go down:
1. Loan volumes will increase as cheaper loans increase demand. More loans mean more interest income, compensating somewhat for the lower spreads.
2. Lower defaults will reduce losses as cheaper loans lead to fewer customers unable to repay them.
3. Nu will increase fees, driving fee income. Nu fee income has been growing more slowly than net interest income for years. I will expand on this in the revenue section of this report.
4. More transaction income, as low interest rates lead to more transactions.
So lower interest rates would certainly be a headwind for net interest income, but Nu would find other means of filling in the gap, reducing the net loss from lower spreads.
Moving on to deposits, Brazil showed weak growth, attracting $500M in new deposits to reach a balance of $33.7B!
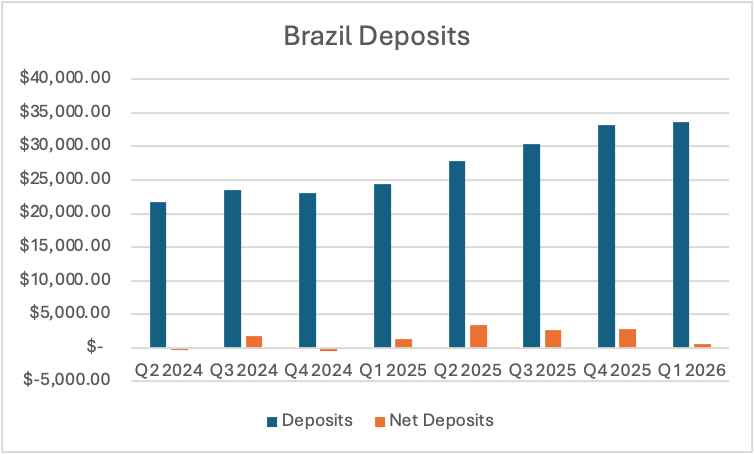
This was an increase of 38% Y/Y, but just 1.5% Q/Q, with net deposits decreasing by 62% compared to Q1 2025.
The management explained that slower deposit growth is due to seasonality, as Q1 is historically weaker. Another explanation was that Nu has a large enough deposit base to fund its loans. So they don’t believe there is a need to be more aggressive with their deposit interest rates to attract more deposits.
They can always increase deposit yields and run promotions if they see that additional capital is required to fund lending.
This quarter, the company revealed that they only have a 7% gross profit market share in Brazil, despite having over 62% of the adult population as customers.
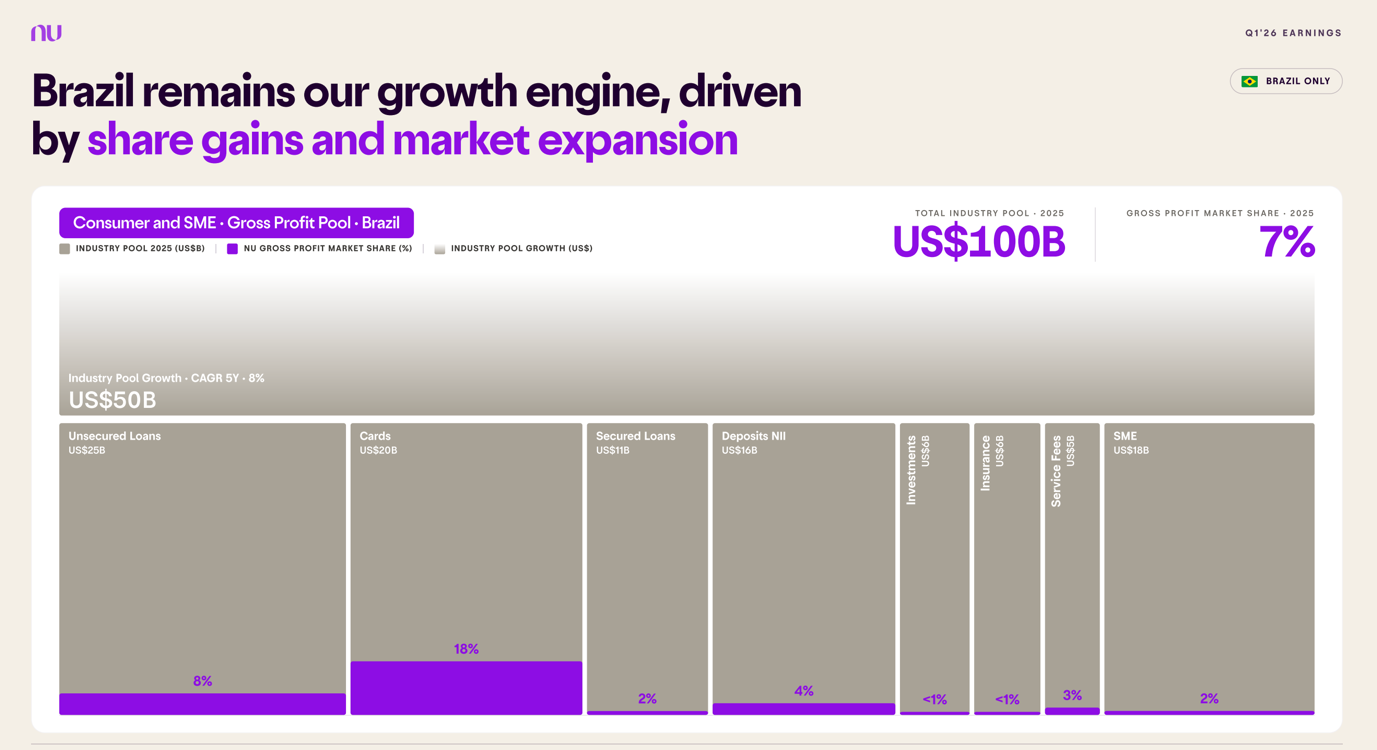
A large share of this industry profit pool is generated by high-income customers, so Nu is working to attract these customers.
“Out of the high income, we now have about two out of every five high-income Brazilians are customers of Nubank. The customer base has grown by about 24% year-over-year ….. With Nu monthly credit card, kind of, volumes up 42% year-over-year. Assets are under custody by like 36%. We are seeing lots of traction there.” Guilherme Lago, Nu CFO
The Nu CFO said that the company is focused on attracting and serving what they describe as “Super Core” segment, which consists of people earning BRL 5-12K per month, about $1-2K. The number of customers in this category is up 24% Y/Y, compared to 10% overall growth in Brazil.
3. Mexico
As of Q1 2026, Nu Mexico has 15M customers, around 15% of the adult population.
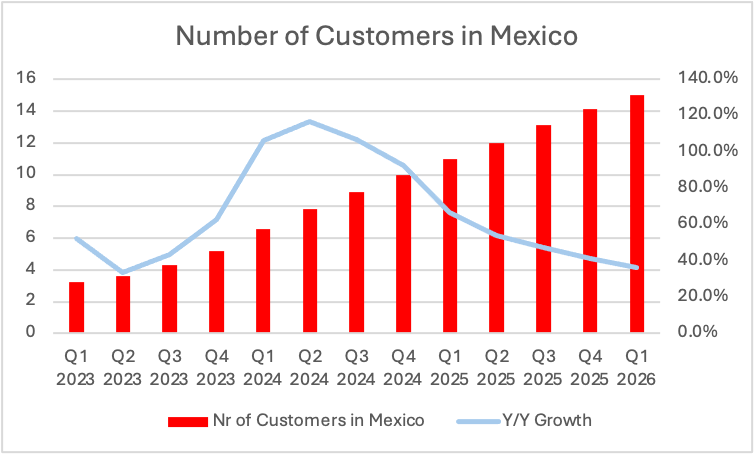
This is an increase of 36.5% Y/Y and 127% in just 2 years!
While I doubt that Nu can reach as high a penetration as Brazil’s 60%, I am confident there is still a lot of growth left in Mexico.
A reminder that Nu received a full Mexican banking license just last year. Previously, they operated under a non-bank financial institution license (SOFIPO), which is a special Mexican regulatory framework that allows FinTechs to provide some banking services, but with a lot of limitations.
A full banking license enables Nu to offer more services to its clients. This helps it to attract more customers and increase wallet share with existing customers.
Deposit balance fell to $5.9B, down 6.3% Q/Q, but still up 9% Y/Y.
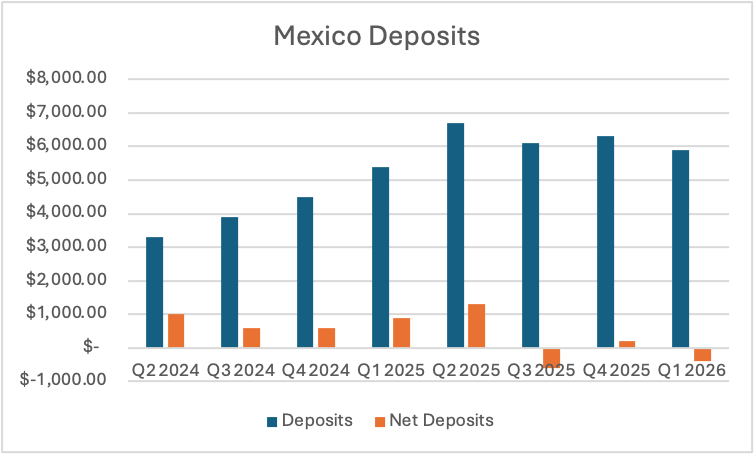
Similar to Brazil, the leading explanations for slow deposit growth are seasonality and a focus on lower-cost capital funding means.
Next, revenue in Mexico grew by 96.5% to $289M.
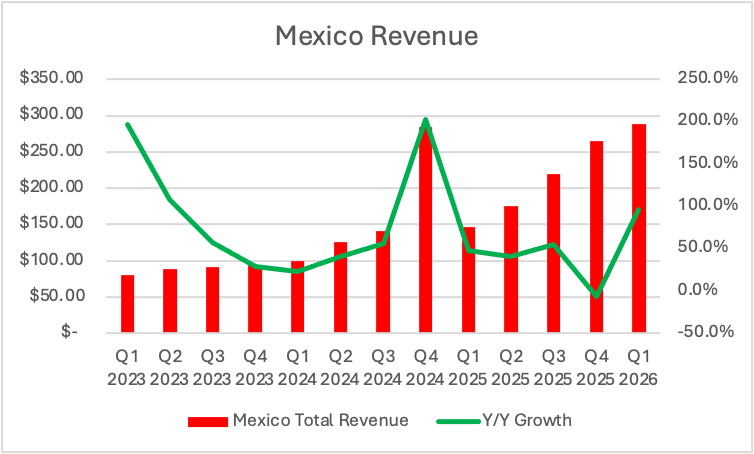
The same as with Brazil revenue, this is an accounting and classification issue. In Q4 2024, a lot of revenues were classified as originating in Mexico and fewer from the HQ. Ignoring that spike, we see a clear trend line of revenue going up at a steady pace.
This quarter, Nu disclosed some new and interesting KPI’s for the Mexican business.
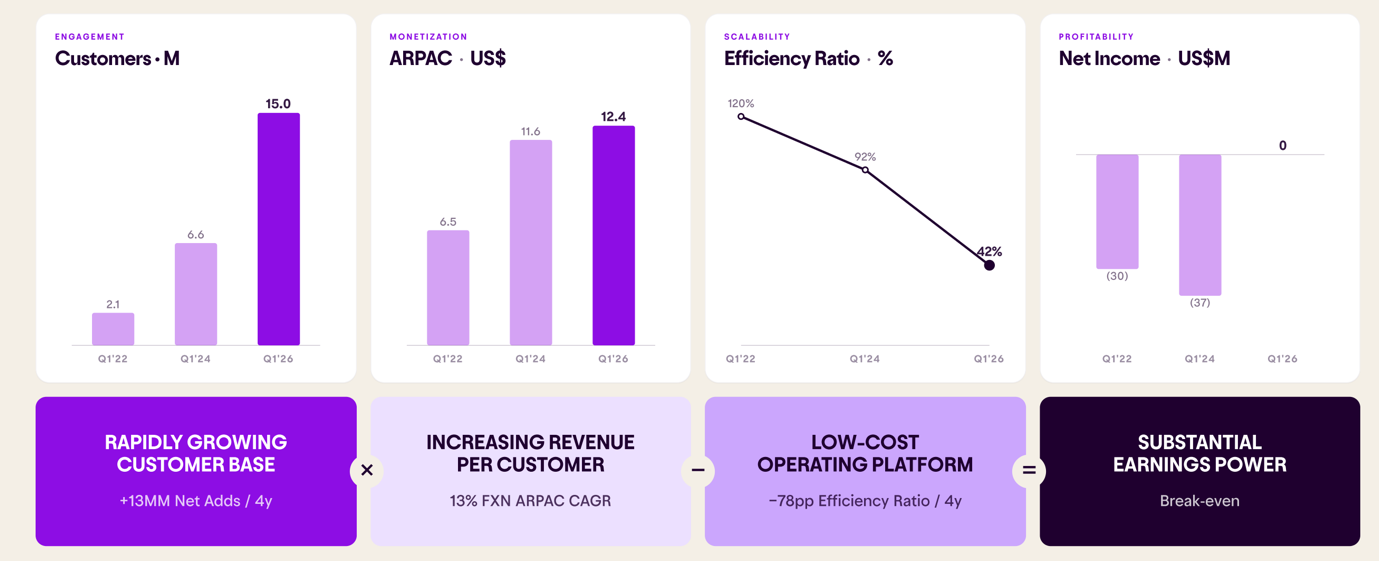
Nu revealed that Mexico is now at net income break-even, compared to a $37M loss in Q1 2025!
This is why Nu didn’t want to overpay for deposits, as then they would not have been profitable. Now that they are, deposits will likely grow in the second half of the year.
Most importantly, we see that the efficiency ratio fell to 42% from 120% in 2022.
Simply put, in 2022, it cost Nu $1.2 to generate $1 of revenue in Mexico, but today it costs $0.42.
ARPU is up to $12.4, double the $6.5 the company was making in 2022.
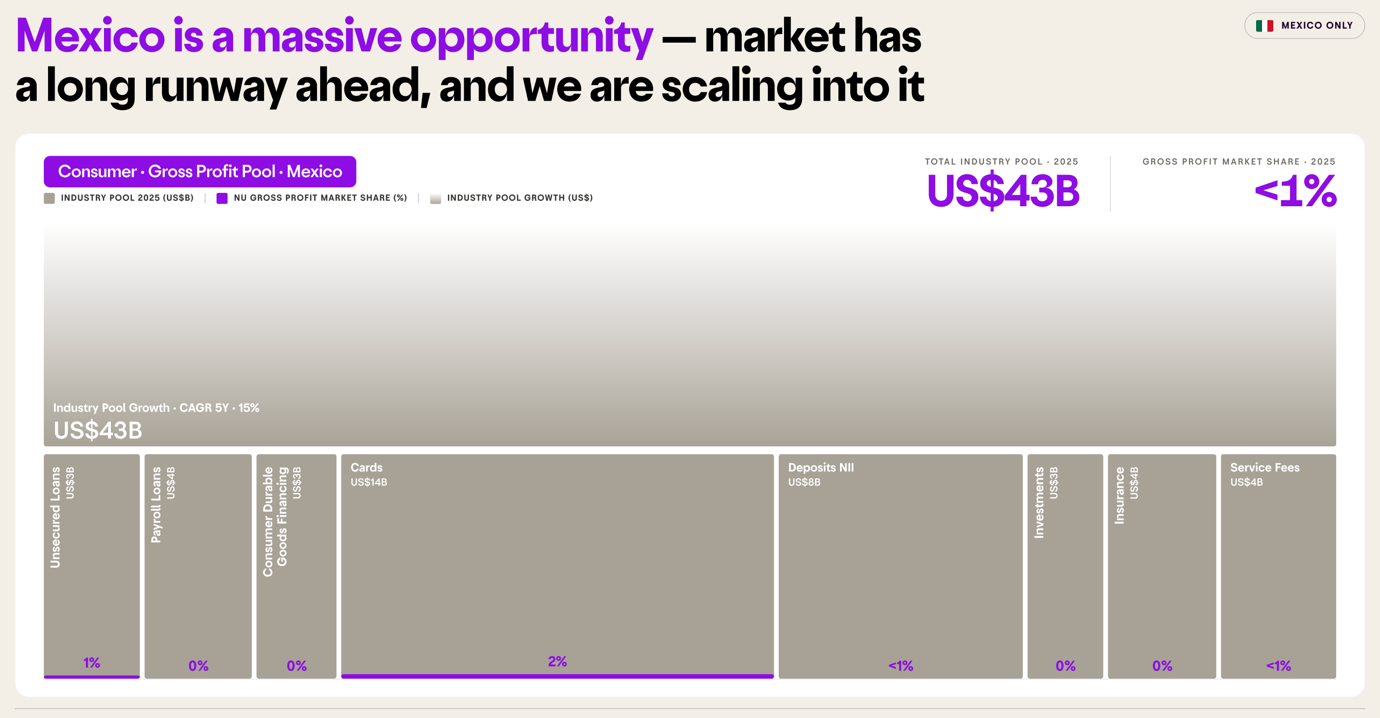
Compared to Brazil, Nu’s runaway in Mexico is even longer.
The company only has a 1% market share, despite having about 15% of the adult population as customers.
4. Colombia
In Q1 2026, Nu Colombia added 500K customers, reaching 4.7M.
This compares favorably to 400K added in Q4 2025.
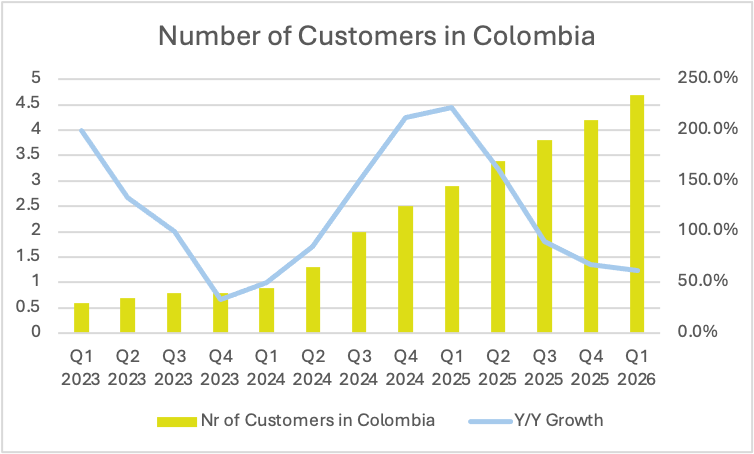
This is an increase of 62.1% Y/Y and 422% in just 2 years!
Nu Colombia has already onboarded 11% of the adult population, quite impressive considering they only began operations 5 years ago.
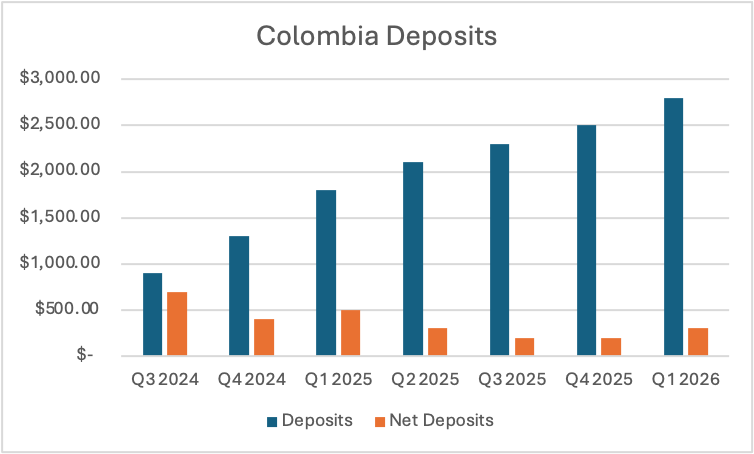
This quarter, Nu Colombia reached $2.8B in deposits, an increase of 56% Y/Y and 12% Q/Q!
As we can see in the graph, this is a 10x growth in the deposit base in just a year and a half!
Nu didn’t disclose anything else about Colombia, as the business is still small.
I will be paying close attention to see how Colombia develops. So far, user and deposit growth have been stronger than in Mexico and Brazil at this age in the market.
5. Deposits and Loan Portfolio
Total Nu deposit balance grew 34% Y/Y to $42.4B.
On an FX-neutral basis, deposits grew 22% Y/Y.
Net deposits were $500M, which was an 81% Y/Y decrease and 84% Q/Q decrease.
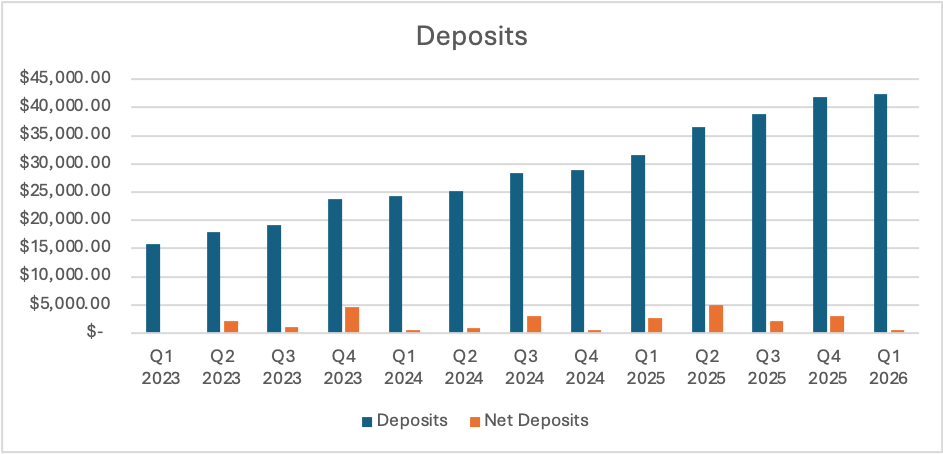
As I already explained in the Brazil and Mexico section, deposit growth was low this quarter due to seasonality and focus on lower-cost sources of capital. If Nu needs more capital, they can increase deposit rates.
Nu cost of deposits is now at 88% of the interbank exchange rate, down from 90% in Q1 2025. Essentially, Nu is paying its depositors smaller yields than last year, helping the company lower interest costs, increasing net interest income.
Banks grow their deposit base for essentially only one reason, to issue more loans to generate interest income.
Total loan portfolio grew 54% Y/Y and 40% FXN to $37.2B.
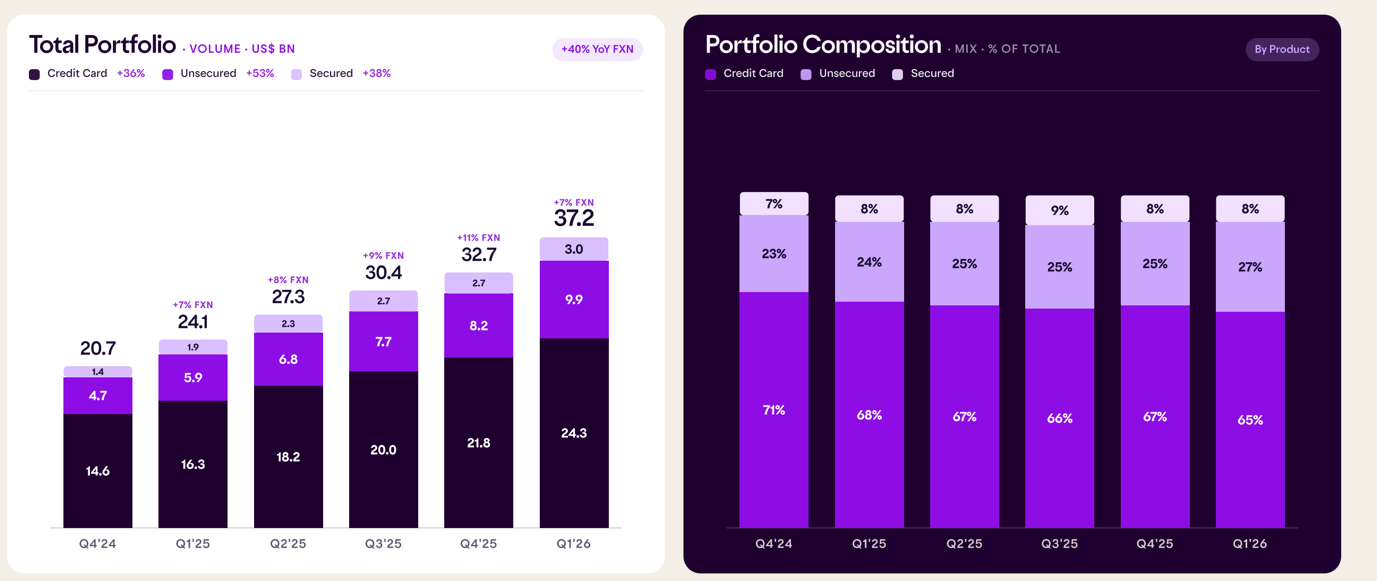
53% FXN growth in unsecured loans was the main contributor to the loan portfolio growth. Meanwhile, the credit card loan share of the portfolio decreased from 68% in Q1 2025 to 65% this quarter.
While the credit card share is still huge and significant, Nu’s change in the portfolio mix displays Nu’s strategy to originate more diversified, higher-quality, longer-term loans.
This means that Nu is less reliant on revolving credit card balances that are paid off monthly and don’t generate interest.
If we look at Q/Q growth in secured loans, we see that it was 11%, from $2.7B to $3B. This is an improvement, as last quarter there was no growth due to the regulatory changes in Brazil. Last quarter, there was a 50% decline in new volumes for the secured unemployment fund loans, as the government made changes to regulations.
In Brazil, there is a fund that is designed to help workers in case of unemployment, but there is a way to use that fund as collateral and borrow against it. That was not the intention of the regulator, so they introduced new limitations, making such loans less attractive to borrowers.
Nevertheless, the quality of their loan portfolio remains stable.
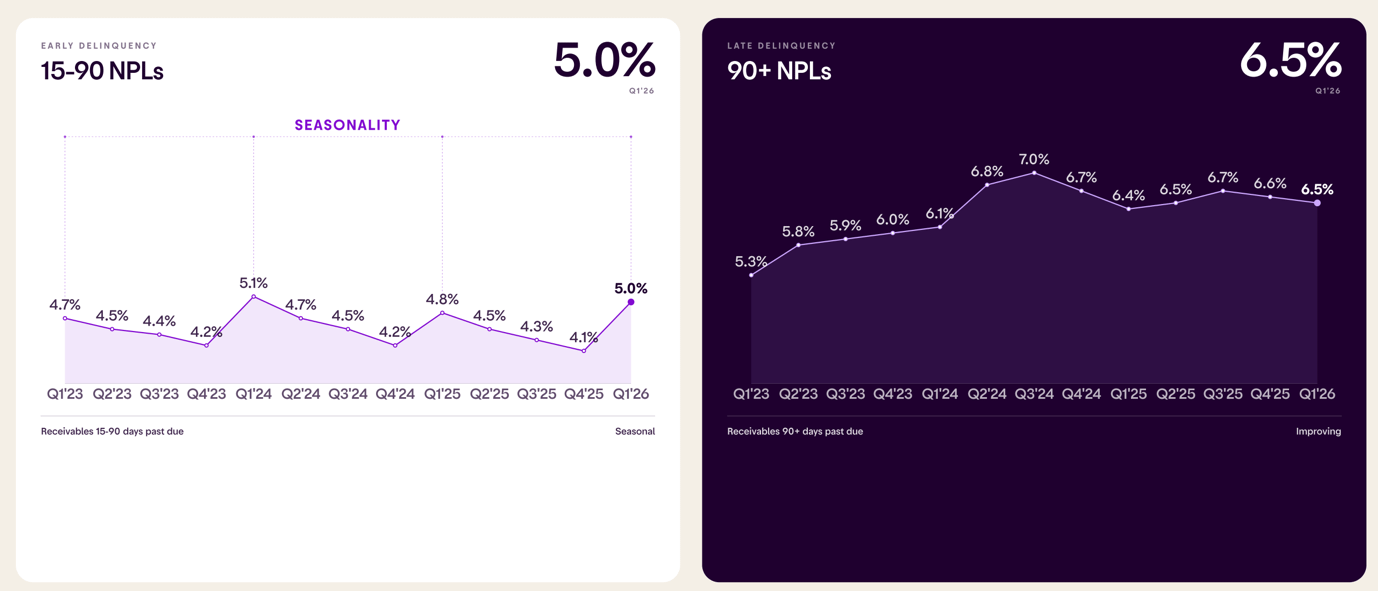
The share of 15-to-90-day nonperforming loans increased from 4.1% to 5% Q/Q, and from 4.8% in Q4 2024.
90+ day NPL also increased from 6.4% in Q1 2025 to 6.5%.
The company explained that this increase in delinquency is largely seasonal, as Q1 always has more defaults, with people who overspent during the Q4 holidays not paying their loans.
Nu released this bridge to compare delinquency to Q4 2025.
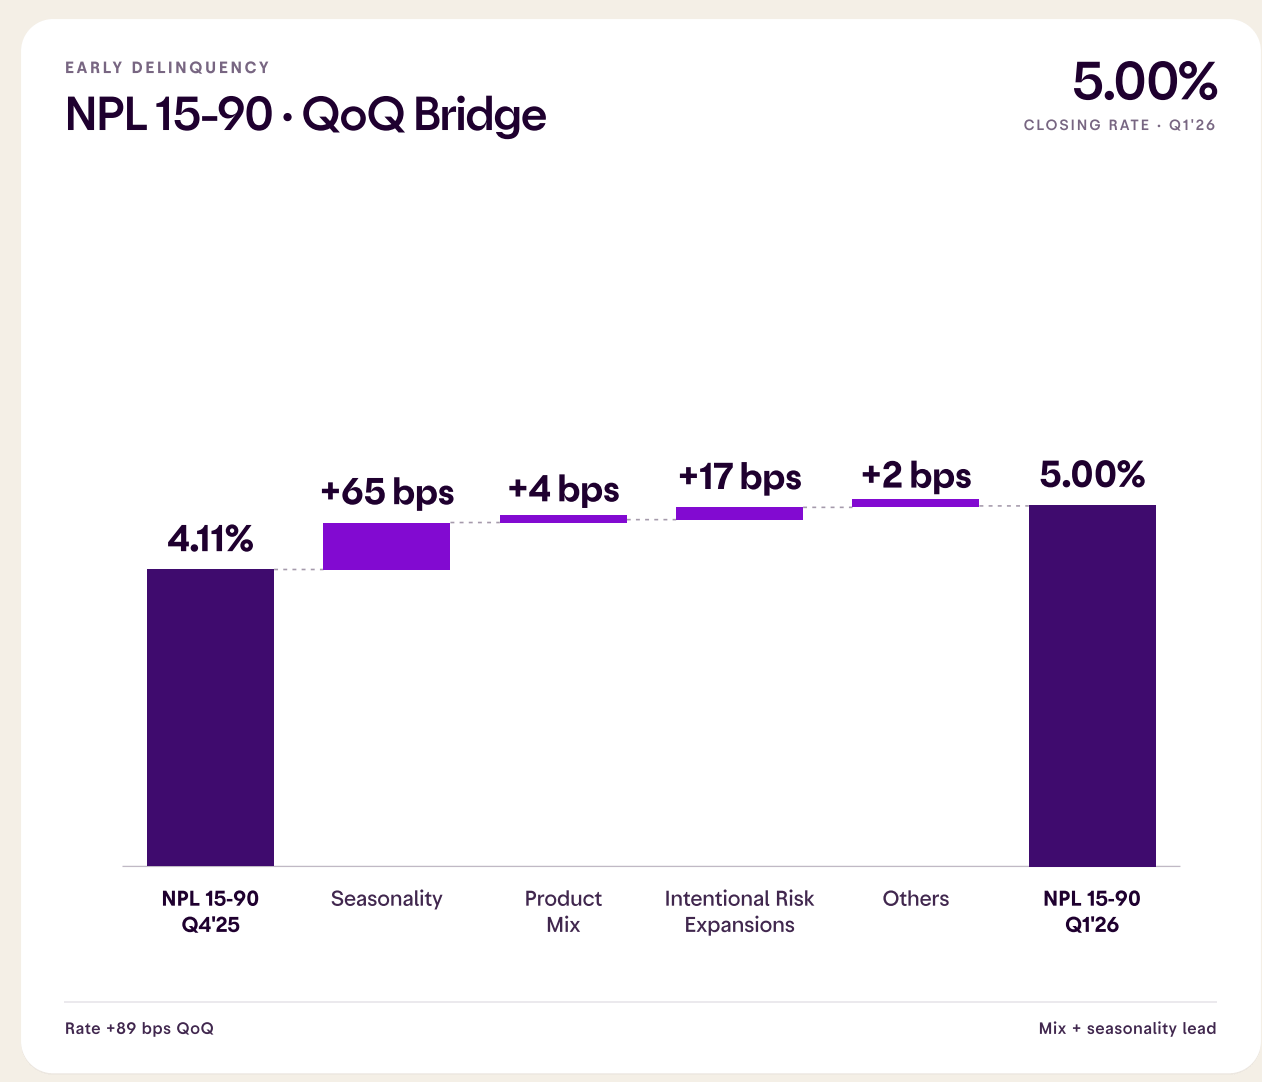
From the 99 basis point increase, 65bps are seasonal, 4bps relate to different product mix, and 17bps are due to intentional risk expansion. Essentially, took more risk this quarter, but the company believes that additional risk will result in higher profits as additional interest will compensate for higher delinquencies.
6. Revenue
Total revenue grew 53% to $5B, driven by a 56.5% increase in interest income and a 34.4% increase in fee income!
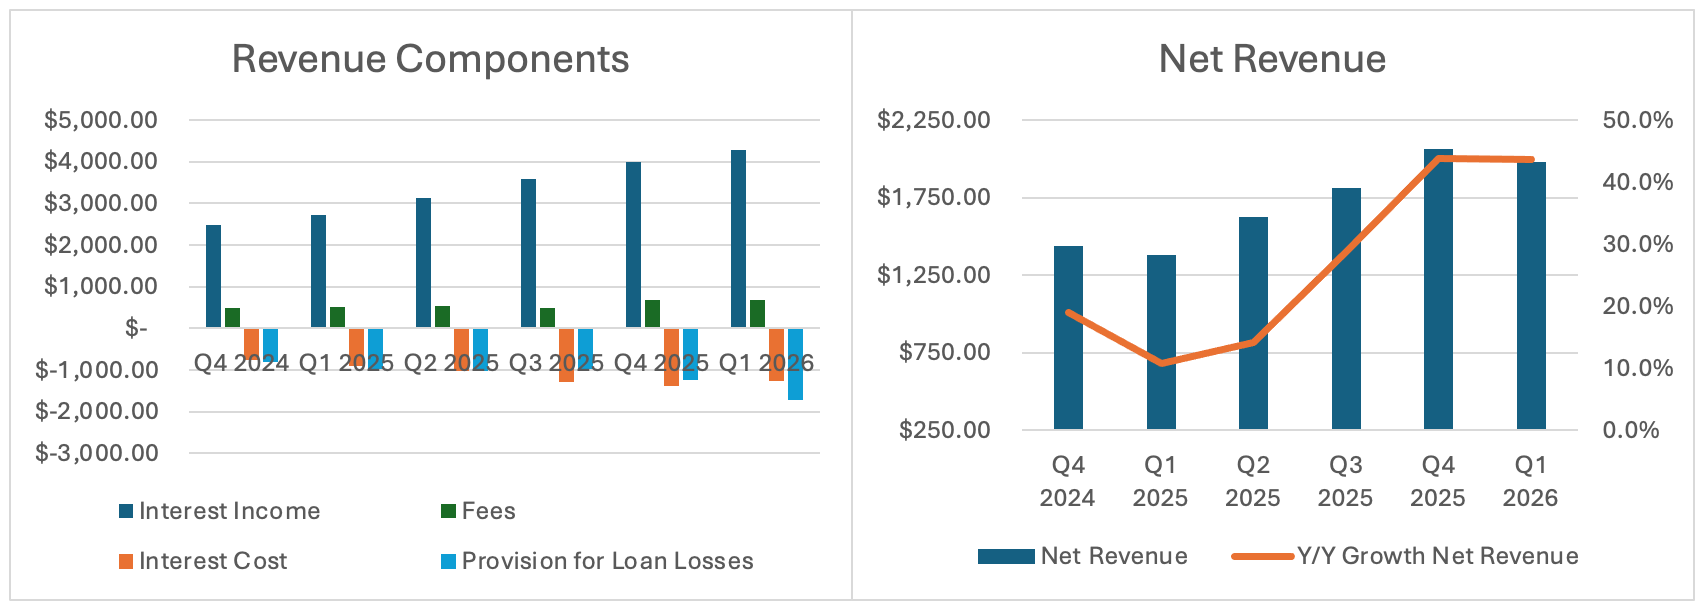
However, net revenue (which I defined as Fees + Interest income – interest cost (NII) – provision for loan losses) grew slightly slower, 43.7% Y/Y to $2B.
This was a slight Q/Q decrease, but as you can see in the chart above, that is the usual seasonality, as net revenue also decreased from Q4 2024 to Q1 2025.
*(Some have questioned why I do it differently than Nu reports. I do this to for me and to make Nu bank more comparable to other banks. Net revenue is comparable to what Nu calls Gross profit)*
The main causes of this lower growth were a 41.6% increase in interest costs and a 76.5% increase in provision for loan losses.
Because of this strong increase in interest costs, the risk-adjusted net interest margin (risk-adjusted NIM) decreased from 10.5% in Q4 2025 to 9.5% this quarter, with net interest income (NII) growing 63.7% to $3B.
The interest costs growing slower than interest income (41.6% vs 56.5%) was largely due to Nu’s weak deposit growth this quarter.
Let’s remember that because of banking regulations, deposits from one country can’t be used for loans in another. This means that Nu must build a new capital base in each country.
Provision for loan losses increased more than the NII (76.4% vs 63.7%) because of a strong growth in the overall loan portfolio and a larger share of unsecured loans in the portfolio (27% vs 23%).
IFRS 9 requires banks to estimate and recognize future loan losses immediately when a loan is issued.
When a bank issues a lot of loans like Nu did, it books high loan loss provisions before it generates any meaningful interest income from these loans.
Additionally, unsecured loans default at a higher rate, thus they require a higher upfront loss provision.
“Credit Loss Allowance or CLA closed at $1.79 billion in the quarter, up 33% quarter-over-quarter (76.5% Y/Y) on an FX neutral basis, mostly driven by three very specific dynamics already mentioned by David Vélez. Number one, seasonality. Number two, portfolio growth. Number three, portfolio mix” Guilherme Lago, Nu CFO Nu Q1 2026 Earnings Call
An interesting point is that interest income grew faster than interest costs for the first time in 5 quarters.
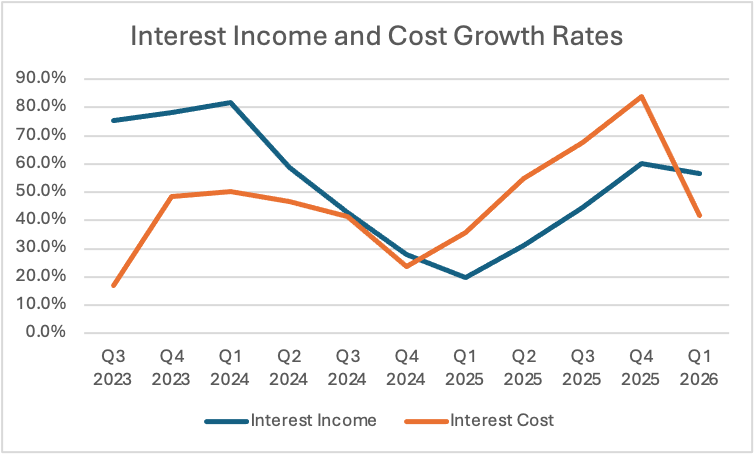
This is what I said in my Nu Q4 2025 review:
“interest cost has grown faster than interest income for 4 quarters in a row. I think this trend could stabilise now, as the company builds out its deposit base.” Ray Myers, Global Equity Brefing, Nu Q4 2025 Earnings Review
This is exactly what we saw this quarter.
7. Profitability
In Q1 2026, Nu generated $872M in net income, up 56.5% and 41% FXN Y/Y!
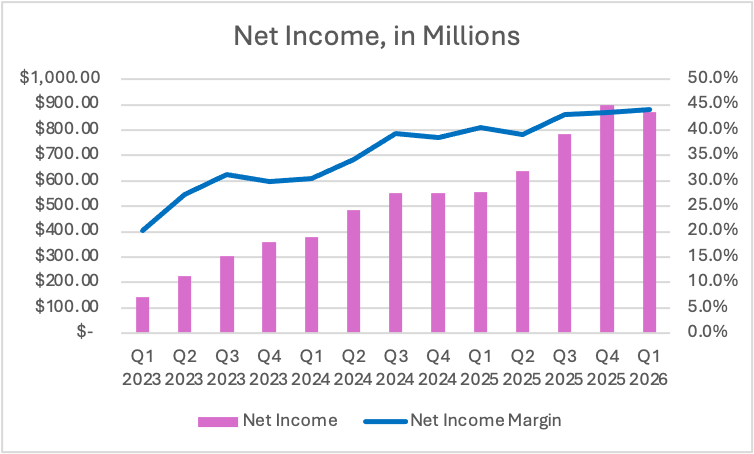
The chart above shows that Nu is a king of profitability with no signs of slowing down. The net income margin increased Q/Q from 43.5% to 44%.
ROE, which basically measures a bank’s return from its net assets, increased from 27% in Q1 2025 to 29%.
However, Wall Street didn’t like the sequential decline, as ROE was 33% in Q4 2025. It seems investors don’t understand seasonality, as ROE also declined from Q4 2024 to Q1 2025.
Most banks can only dream of such a high ROE. This level of profitability can only be possible with incredible operational efficiency.
Despite the strong ROE, the street didn’t like the increase in the average cost per active customer.
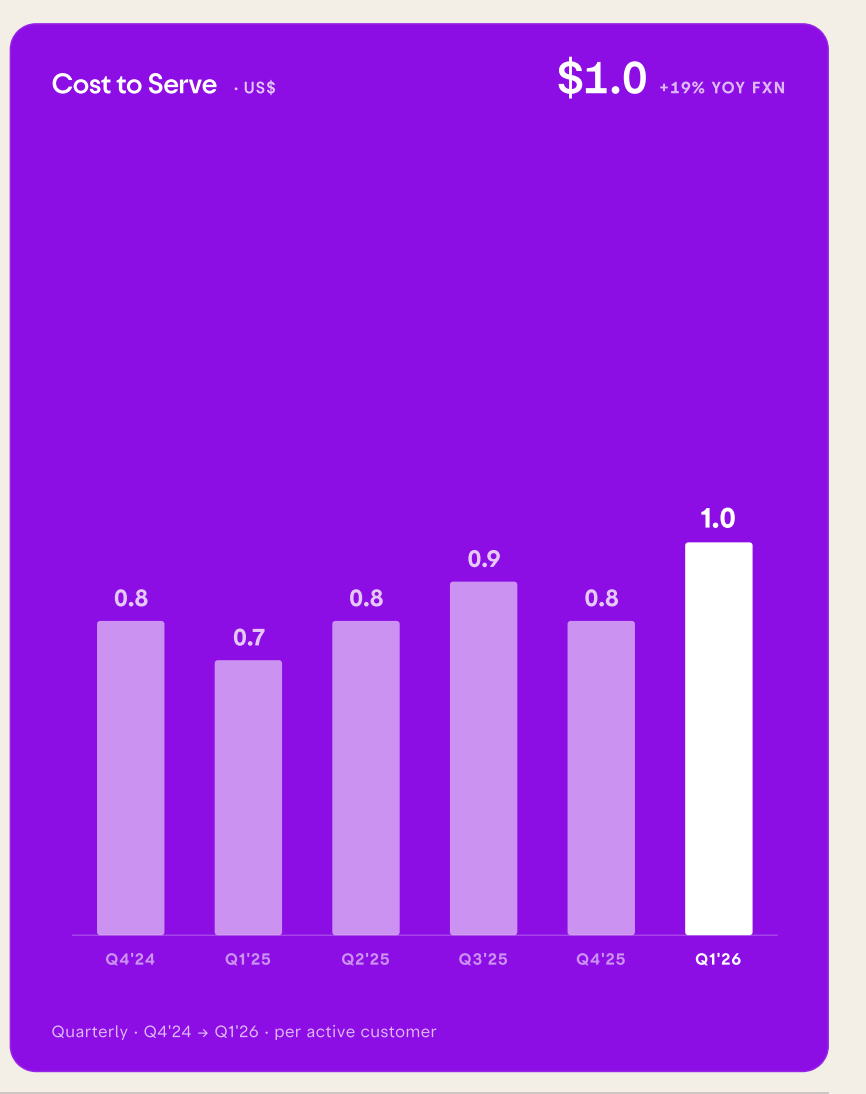
As we already discussed earlier, the cost per active customer increased 19% Y/Y on FXN basis, but still remains at an incredible $1.
Another metric to monitor is the efficiency ratio!
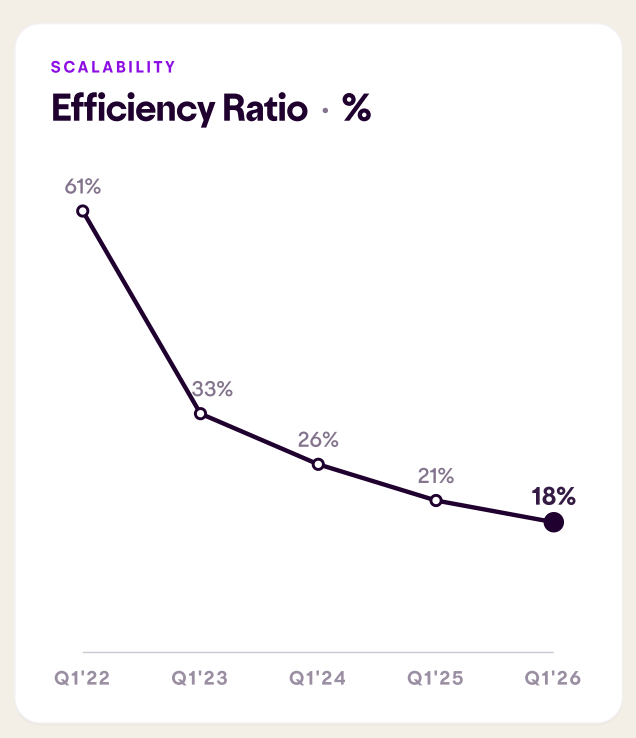
It measures operating expenses as a share of net revenue, and as you can see in the graph above, it has been steadily going down from 21% in Q1 2025 to 18% today.
Nu is better at using technology to serve a large number of customers than possibly any other bank in the world!
Nu’s efficient operating model allows low prices and high profits. This is a potent combo for explosive global growth!
However, Nu did miss the street analyst’s EPS estimate of $0.19 by 1 cent.
This was due to Nu spending heavily to prepare for the next leg of growth.
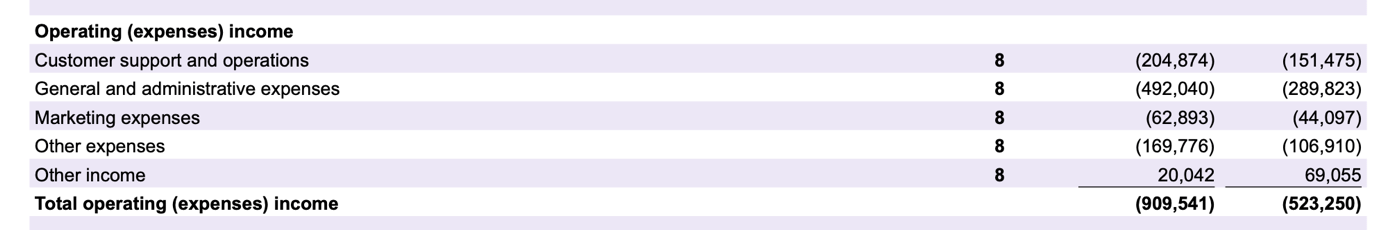
Customer support costs grew by 58.8% to $205M.
SG&A grew by 69.8% to $492M.
Marketing grew by 42.6% to $63M.
Other expenses grew by 58.8% to $170M.
Nu is investing in AI to automate customer support and operations. They are putting AI at the center of the organization, and that is incredibly expensive. It will take some time for efficiencies to appear.

Let’s not forget that Nu just sponsored MLS team Inter Miami, where Messi plays.
They signed a 5-year deal that cost many millions, and it will take time for the company to recoup this investment once they enter the US market.
Overall, Nu delivered another incredible quarter of profit growth.
However, net margin will likely not grow as fast as before, due to the investments that the company must make to grow in the US. But I don’t care much about the few basis point difference in the margin, I care about the absolute dollar EPS growth.
I have high confidence in the Nu and this management team.
8. Conclusion
In conclusion, Nu delivered another strong quarter of strong profit growth, yet in this market, investors and algos are looking for the tinniest reason to sell a stock.
As I mentioned in the introduction, there is a FOMO trade happening right now in the market.
Sell quality, especially SaaS and fintech, and buy AI stocks!
The AI boom is real, and there are many stocks that are delivering real results and deserve the AI hype, but there are many that do not. Some stocks have run over 1,000% this year, and a lot of investors are selling their SaaS and fintech stocks that are down 20-40% to buy AI stocks up 100-500%.
I don’t believe that this is a profitable trade. Selling quality companies at such depressed levels to buy hype stocks is a recipe for disaster.
I believe that this trade will end soon, as fintechs such as Nu, DLocal, Klarna, and Sofi are trading at unsustainably low valuations.
Companies with strong balance sheets, increasing TAM, and 30-40% topline growth don’t deserve to trade for sub-20 FWD P/E. Nu trading for a FWD P/E of 14, despite such strong growth and quality characteristics, is objectively unbelievable.
Eventually, the market will return to wanting profits, as it did in 2022 after the 2021 EV/SaaS bubble burst.
I am investing accordingly.

Here is what my Premium Members can expect:
Portfolio Review - Each month, I will present the portfolio performance and discuss my stock watchlist and my best ideas.
Recent developments.
Unwarranted pullbacks.
Insider activity.
Potential catalysts.
Deep Dives – 8,000+ word detailed analysis of a company, delivered in 3 Parts.
Part 1 – Brief History of the company and its Business Model.
Part 2 – Management, Moats, Competitors, and Risks.
Part 3 – Opportunities, Financial Analysis, and a Valuation Model.
You can expect a comprehensive research report that is educational, interesting, and provides actionable insights!
To see what you can expect, read my Palantir Deep Dive!
Members of the Premium service get access to my library of 12 Deep Dives and to all future Deep Dives, which will be released on semi-monthly basis.
Investment Cases – A short, concise report with actionable insights.
This report is about the size of a single part of a Deep Dive.
Focused Investment Thesis
Main drivers of the Bull Case
Valuation Model
To see what you can expect, read my Oscar Health Investment Case!
Earnings Reviews and Updates – For companies that are of great interest to me and my readers, I will provide regular quarterly or semi-annual updates after earnings reports.
Financial performance
Business Update
New developments
Updated Valuation Model
To see what you can expect, read my Google Q2 2025 Earnings Review!
Equity Research Report List
You can follow me on Social Media below:
X(Twitter): TheRayMyers
Threads: @global_equity_briefing
LinkedIn: TheRayMyers
Disclaimer: Global Equity Briefing by Ray Myers
The information provided in the “Global Equity Briefing” newsletter is for informational purposes only and does not constitute financial advice, investment recommendations, or an offer or solicitation to buy or sell any securities. Ray Myers, as the author, is not a registered financial advisor, and readers should consult with their own financial advisors before making any investment decisions.
The content presented in this newsletter is based on publicly available information and sources believed to be reliable. However, Ray Myers does not guarantee the accuracy, completeness, or timeliness of the information provided. The author assumes no responsibility or liability for any errors or omissions in the content or for any actions taken in reliance on the information presented.
Readers should be aware that investing involves risks, and past performance is not indicative of future results. The author may or may not hold positions in the companies mentioned in the “Global Equity Briefing” report. Any investment decisions made based on the information in this newsletter are at the sole discretion of the reader, and they assume full responsibility for their own investment activities.