
Grab Q1 2026: Dealing with Iran War Oil Shock!
Strong GMV, revenue and ADJ EBITDA growth, despite disruptions!

Welcome to Global Equity Briefing, my weekly investing newsletter.
I am Ray, a passionate investor and equity analyst. And today I am covering Grab.
Grab’s stock was already not doing great at the start of the year, but the Iran War accelerated the decline.
The company’s primary delivery and mobility businesses are very dependent on the steady stream of affordable oil to Southeast Asia. The region is one of the biggest customers of Middle East oil, and its economy is very exposed to oil shocks.
Despite these disruptions, Grab delivered great results, continuing to demonstrate that its business model is more resilient than many analysts anticipated.
Best revenue growth in 9 quarters.
ADJ EBITDA growth of 46% Y/Y.
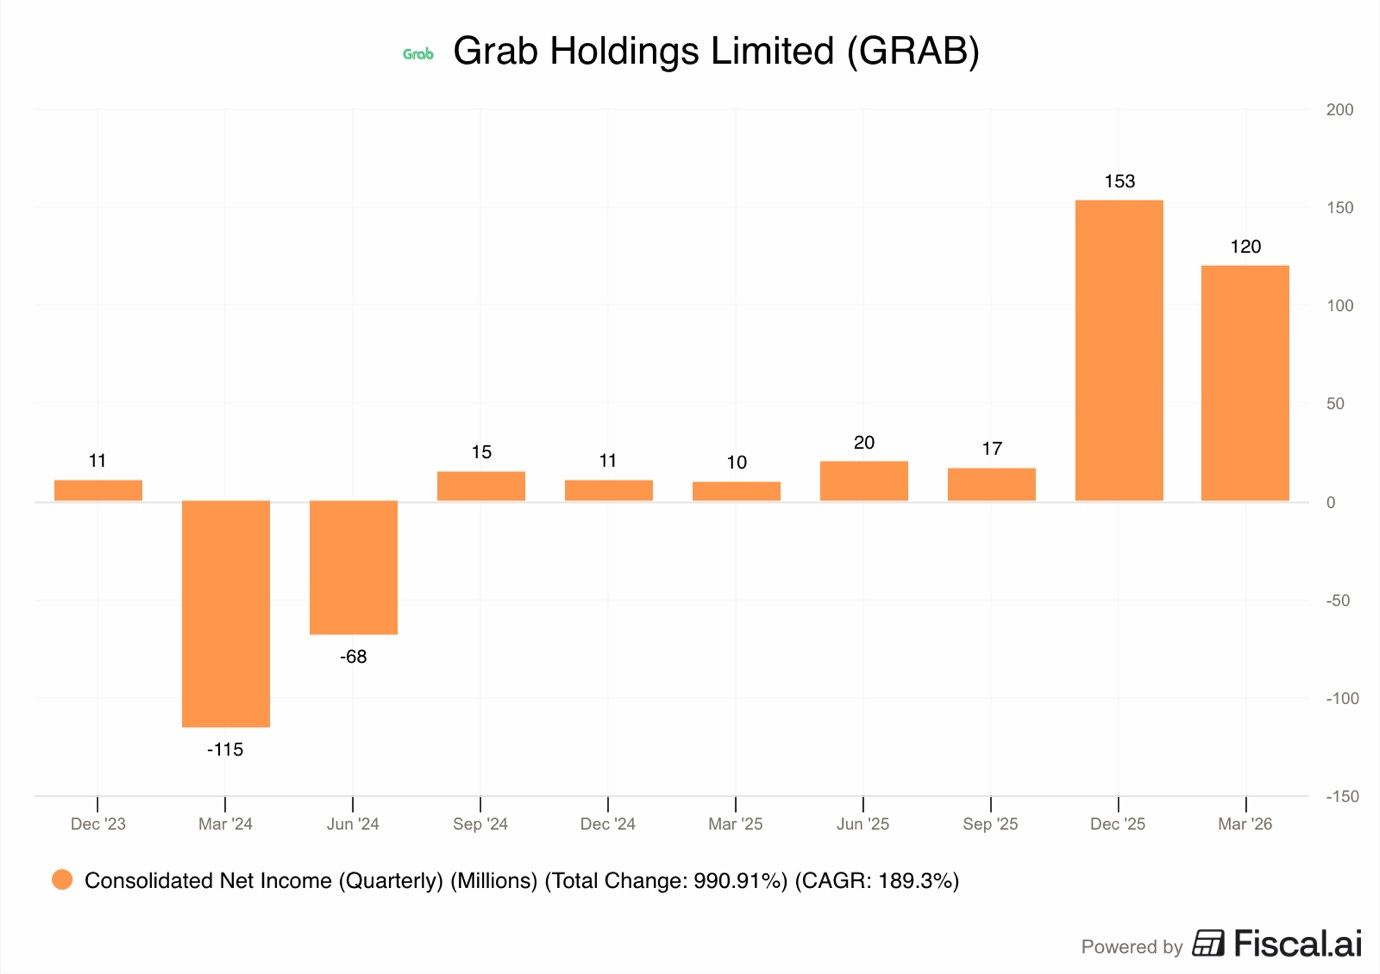
$120M in net income vs $10M last year.
Accelerating GMV growth.
Overall, the start of 2026 was strong for Grab. Even though the first quarter is usually the slowest for the company due to holidays like Chinese New Year and Ramadan, Grab saw its growth accelerate.
The company focused on improving its operations while dealing with the Iran Oil Shock.

1. Overall Results
Revenue $955M +24% Y/Y
ADJ EBITDA $154M +46% Y/Y
EBIT $22M vs -$21M last year
Net Income $120M vs $10M last year
EPS $0.03 vs $0.01 last year
ADJ FCF $98M vs -$101M last year
1.1. Revenue
Total revenue grew by 23.5% Y/Y and 19% in FXN to $955M!
Grab benefited from a weak dollar this quarter, as such, its local currency growth was lower. Recent Trump’s actions, such as the Trade War and Iran War, have significantly weakened the USD, so this quarter the company benefited from that.
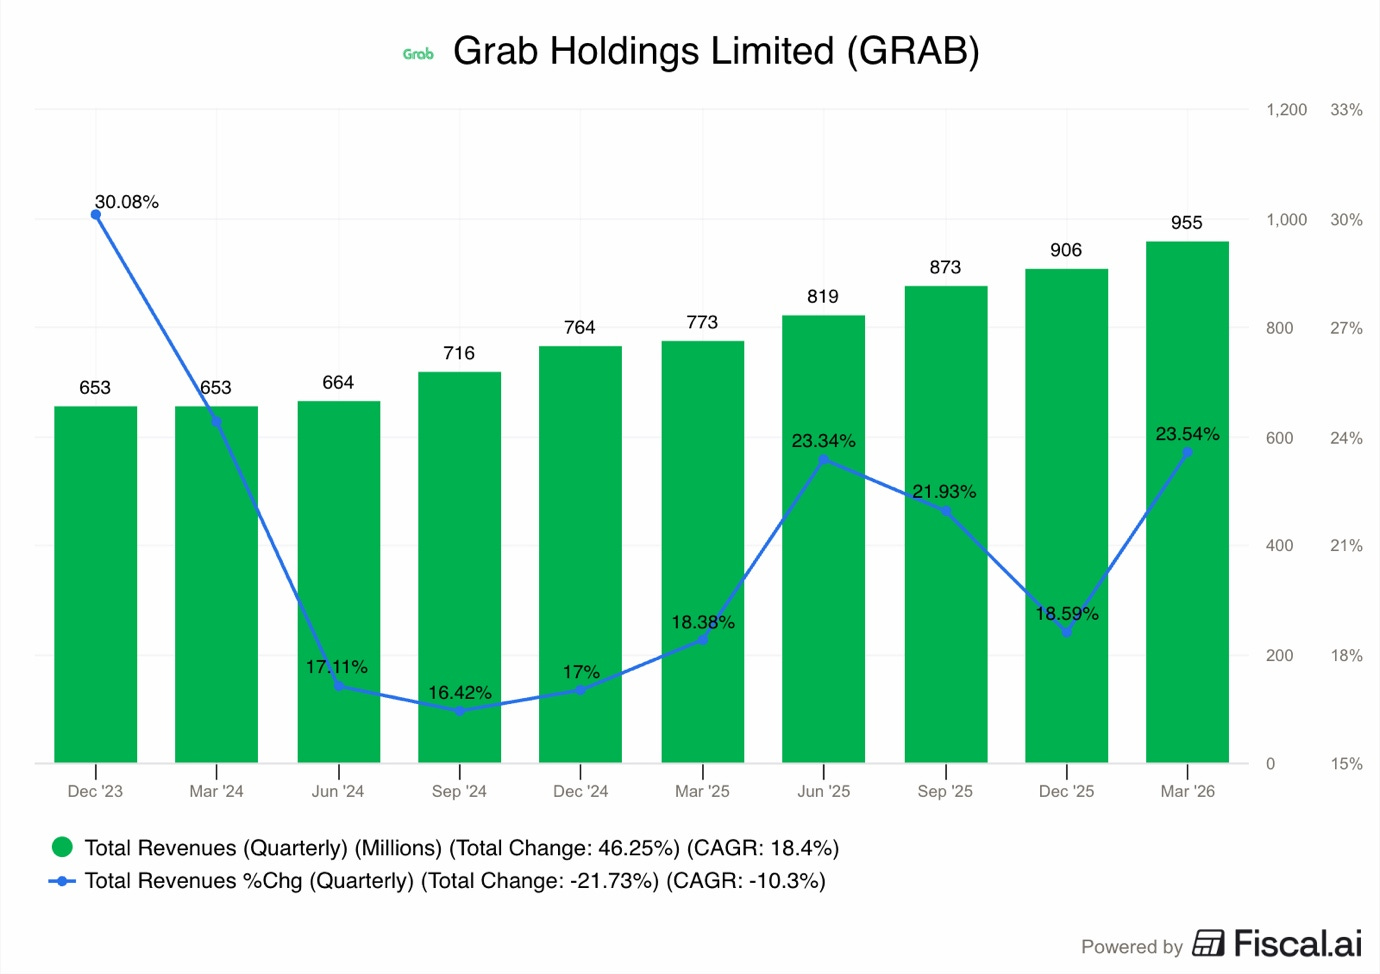
As you can see in the chart above, this was a good acceleration from 18.59% growth in Q4 2025 and 18.4% growth in Q1 2025.
The total revenue of $955M beat what many analysts on Wall Street expected, which was around $938M.
The growth was driven by all segments, and because more people were using the app and they were using it more often, we will expand on this later.
1.2. ADJ EBITDA and ADJ FCF
ADJ EBITDA was $154M, up from $106M in Q1 2025, and 46% increase Y/Y.
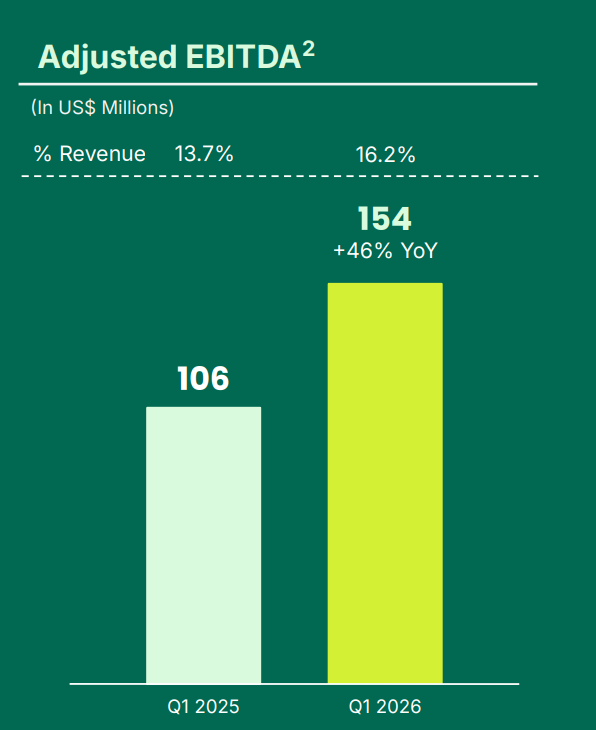
This beat the Wall Street consensus estimate of $142M!
Moreover, the ADJ EBITDA margin improved to 16.2% from 13.7%.
This clearly demonstrates how Grab is getting more efficient and making more profit for every dollar it earns.
Furthermore, looking at cash flow, this quarter, ADJ FCF turned positive at $98M vs $101M loss in Q1 2025.
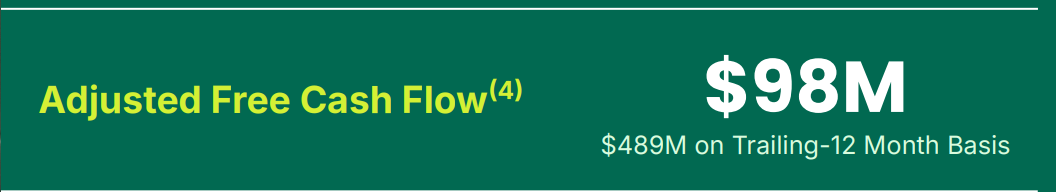
On a trailing twelve-month basis, which looks at the last full year, ADJ FCF reached $489M.
Grab financial services segments distort normal FCF, so Grab shows ADJ FCF, which removes these distortions.
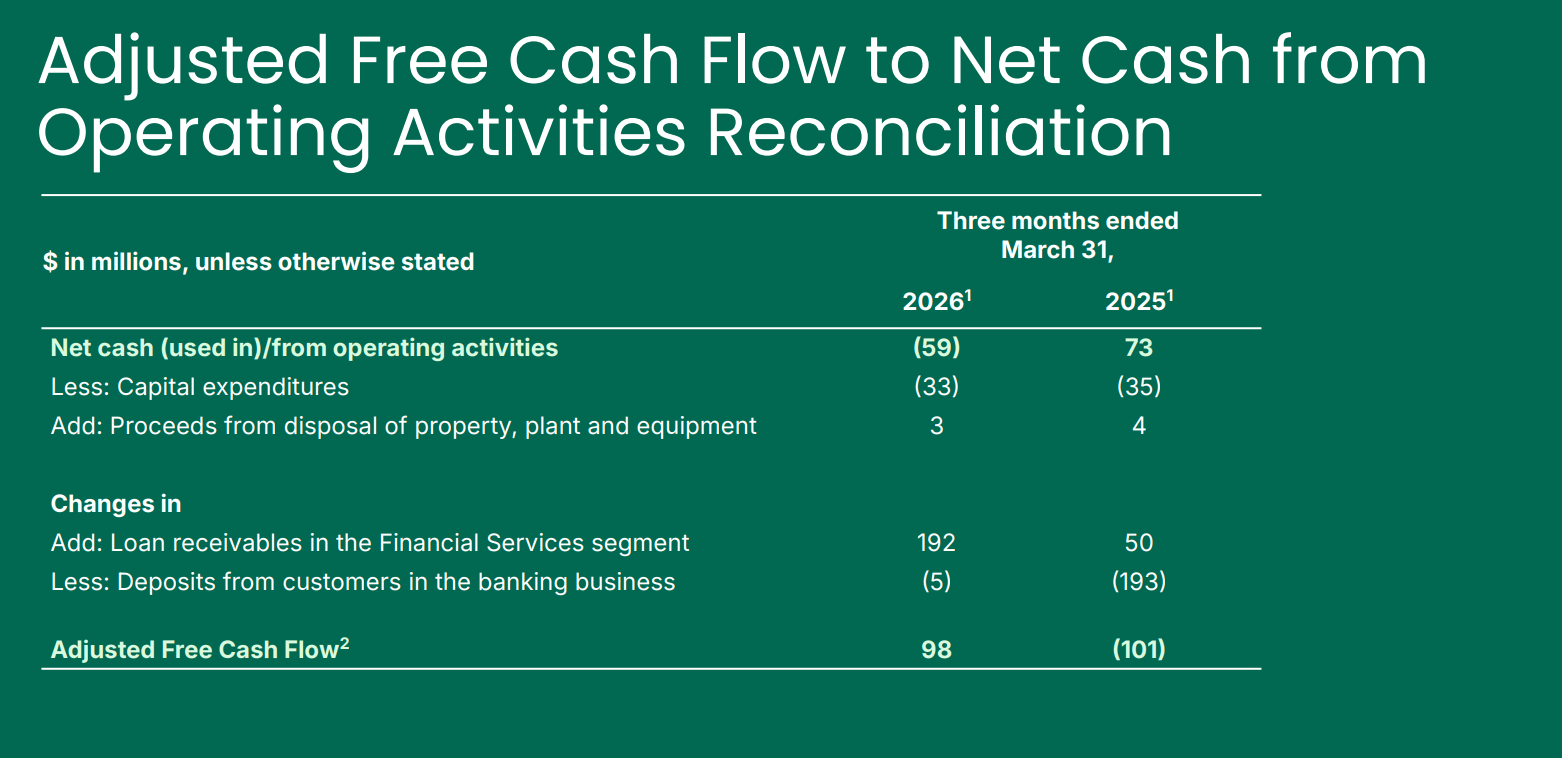
As you can see in the above picture from the earnings presentation, the company adds back the changes in loan receivables and deposits. The loan receivables position increased by $192M vs last year, which simply means that the company issued more loans.
By including it in FCF, it would make it appear that Grab lost money, which is not an accurate representation of its business.
1.3. Net Income and EPS
Grab reported a Net Income of $120M for the quarter, which is a big increase from the small $10M profit they had a year ago.
This was driven by an operating profit of $22M, compared to an operating loss of $21M in Q1 2025. The company also saw a big gain in the fair value of its financial assets, which added net $95M to the bottom line.
The net $95M gain consists of $163M gain on convertible note fair value and $68M of other loss adjustments.
The $163M gain relates to the the $1.5B convertible note Grab issued last year.
Under IFRS rules, Grab must reevaluate the fair value of this convertible note because they are categorised as a derivative financial liability and record gain or loss in each period.
Essentially, if the share price rises, Grab must record a loss as that means the holders of the convertible notes get to convert them into shares at a more favourable price. If the share price falls, as it did during Q1 2026, Grab must record a gain, as the convertible notes become less valuable to the note holders.
US GAAP doesn’t have this, thus Grab is exposed to additional income volatility each quarter.
This is why, even with the $120M profit, the fully diluted EPS was reported as -$0.01 despite basic EPS being $0.03.
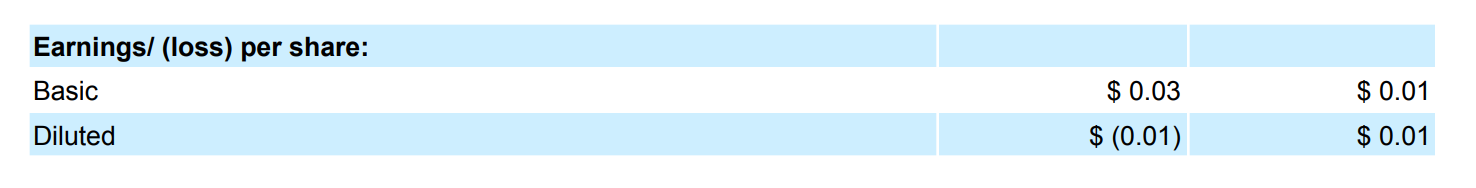
Basic EPS is calculated by dividing net income by basic shares outstanding.
Diluted EPS is calculated by assuming that all outstanding warrants, notes, and employee stock options get converted into equity. This excludes the $163M gain on the fair value of the notes and thus the negative EPS.
This means that without this gain, Grab would not have been net income profitable!
I don’t like this, this essentially makes P/E not a usable metric for evaluating Grab, because the net income swings widely.
1.4. Guidance
Grab decided to keep its guidance for the full year of 2026 the same.
They are confident that they can meet these targets despite the challenges in the region. The company believes that its strong performance in Q1 provides a solid foundation for the rest of the year.
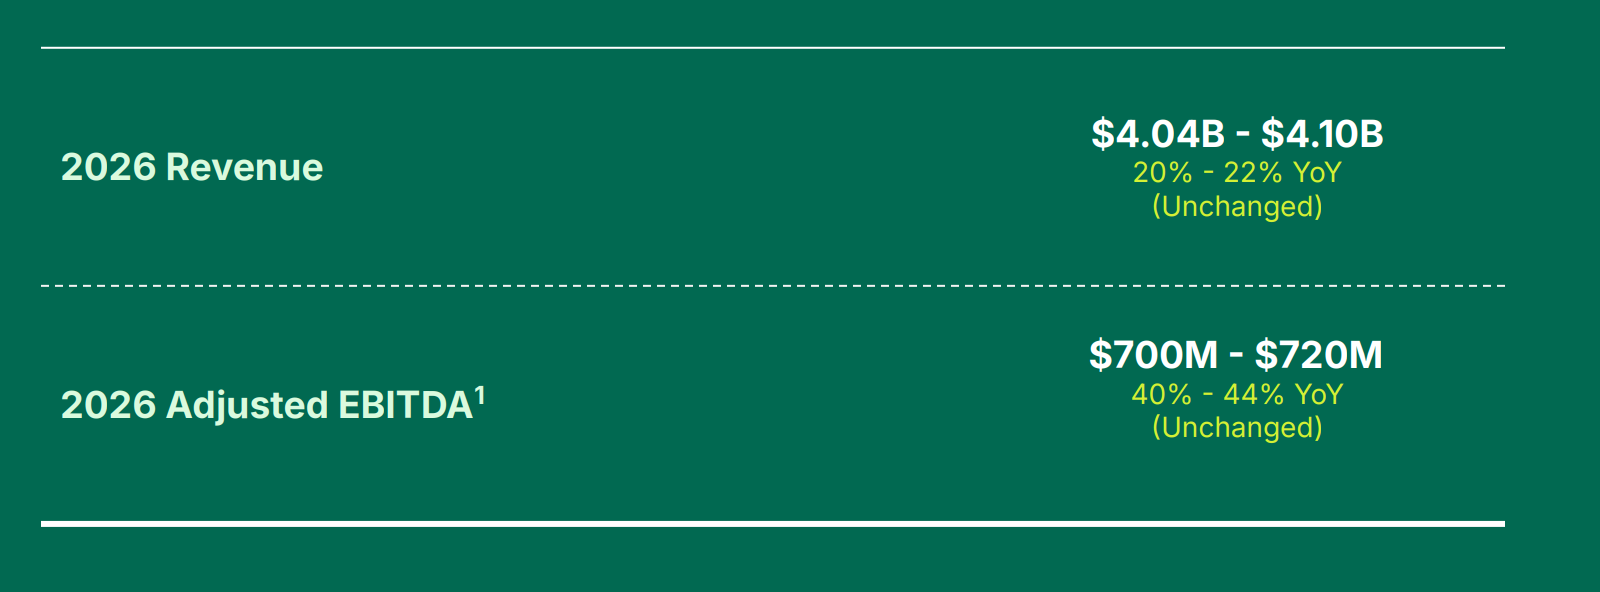
The company expects revenue to grow between 20% and 25% to $4.04-4.10B.
They also expect ADJ EBITDA to grow by 40% to 44% to $700-720M
By keeping this guidance, Grab is telling investors that they have plans in place to handle the fuel crisis and the new rules in Indonesia.
They also mentioned that they have enough cash to buy back up to $500M of their own shares, with $400M already being used in an accelerated program.
2. GMV
In Q1 2026, On-Demand GMV grew by 24% Y/Y to reach $6.1B.
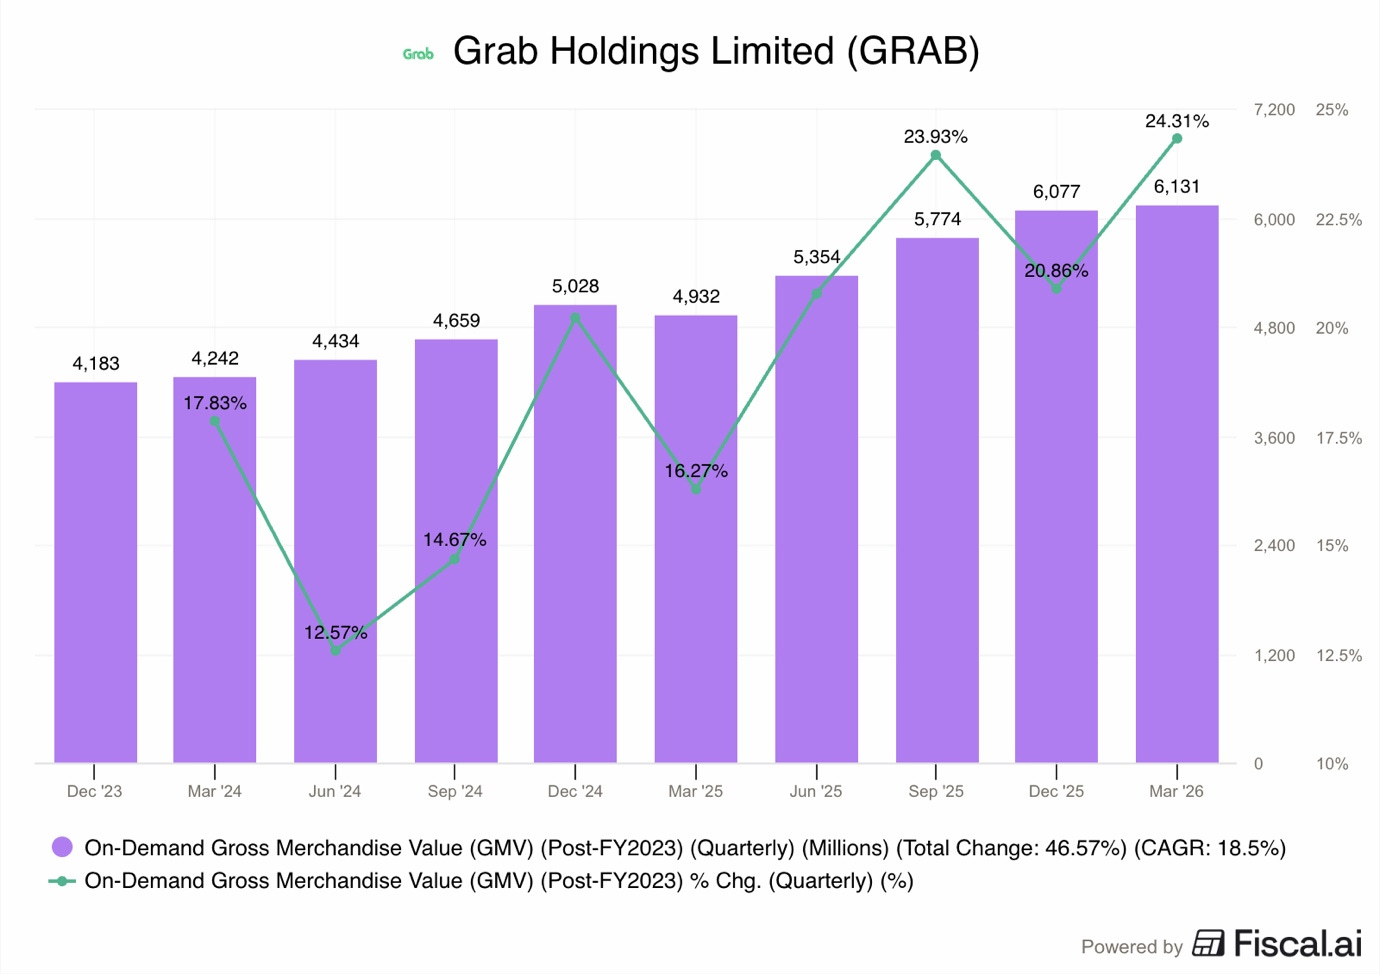
On FXN basis, the growth was 21%. This is a decent result because Q1 is usually a seasonally soft quarter.
GMV Growth accelerated from 20.86% in Q4 2025 and 16.27% in Q1 2025!
The growth in GMV was largely driven by two things.
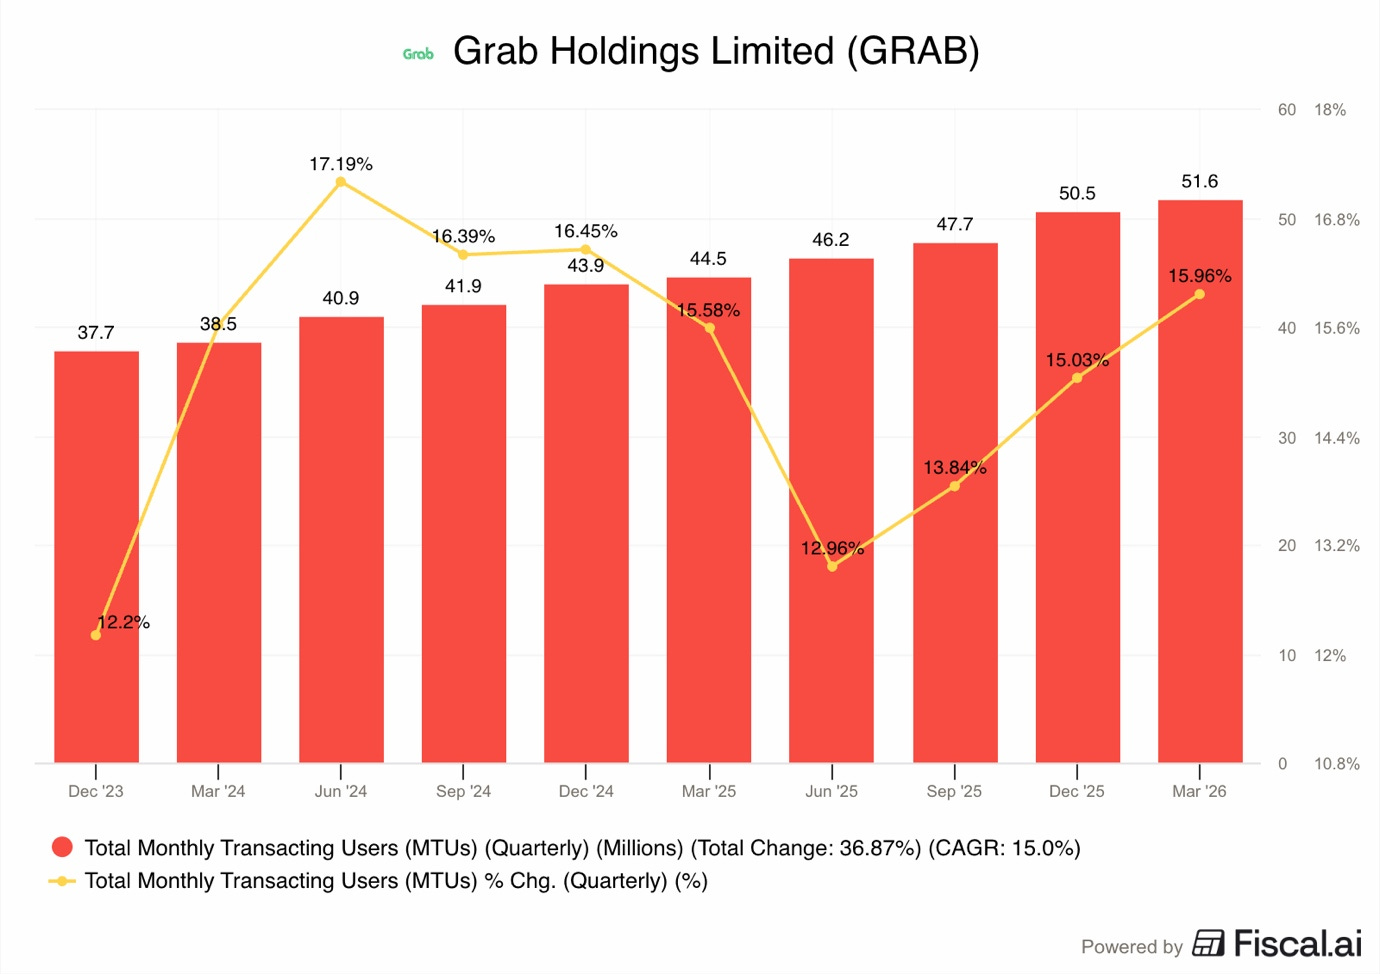
First, the number of users grew by 16% to 51.6M.
This was the fastest user growth 5 quarters, and an acceleration from 15% in Q4 2025 and 15.6% in Q1 2025.
Second, each user is spending more money, with the GMV per monthly active user growing by 7% Y/Y to $130.
This indicates that once people start using Grab, they tend to use it for more things, like ordering groceries or taking more rides.
However, another important driver was incentives, which grew by 29.7%. Ideally, we would want the GMV to grow at a faster pace than incentives, but I will expand on incentives later.
Do you like this report?
Become a Paid Premium member to see dozens of exclusive pay-walled equity research reports such as this.
Curious about which stock I own?
Full portfolio with all holdings, cost basis, and unrealised gains is visible to Premium members. I do weekly updates and detailed monthly reviews. Premium members are also notified of all sales and purchases using the pay-walled Substack Chat.
The annual plan is available for 50% cheaper per month than the monthly plan.
3. Delivery and Mobility
Both delivery and mobility segments saw strong growth in Q1 2026, despite significant outside challenges.
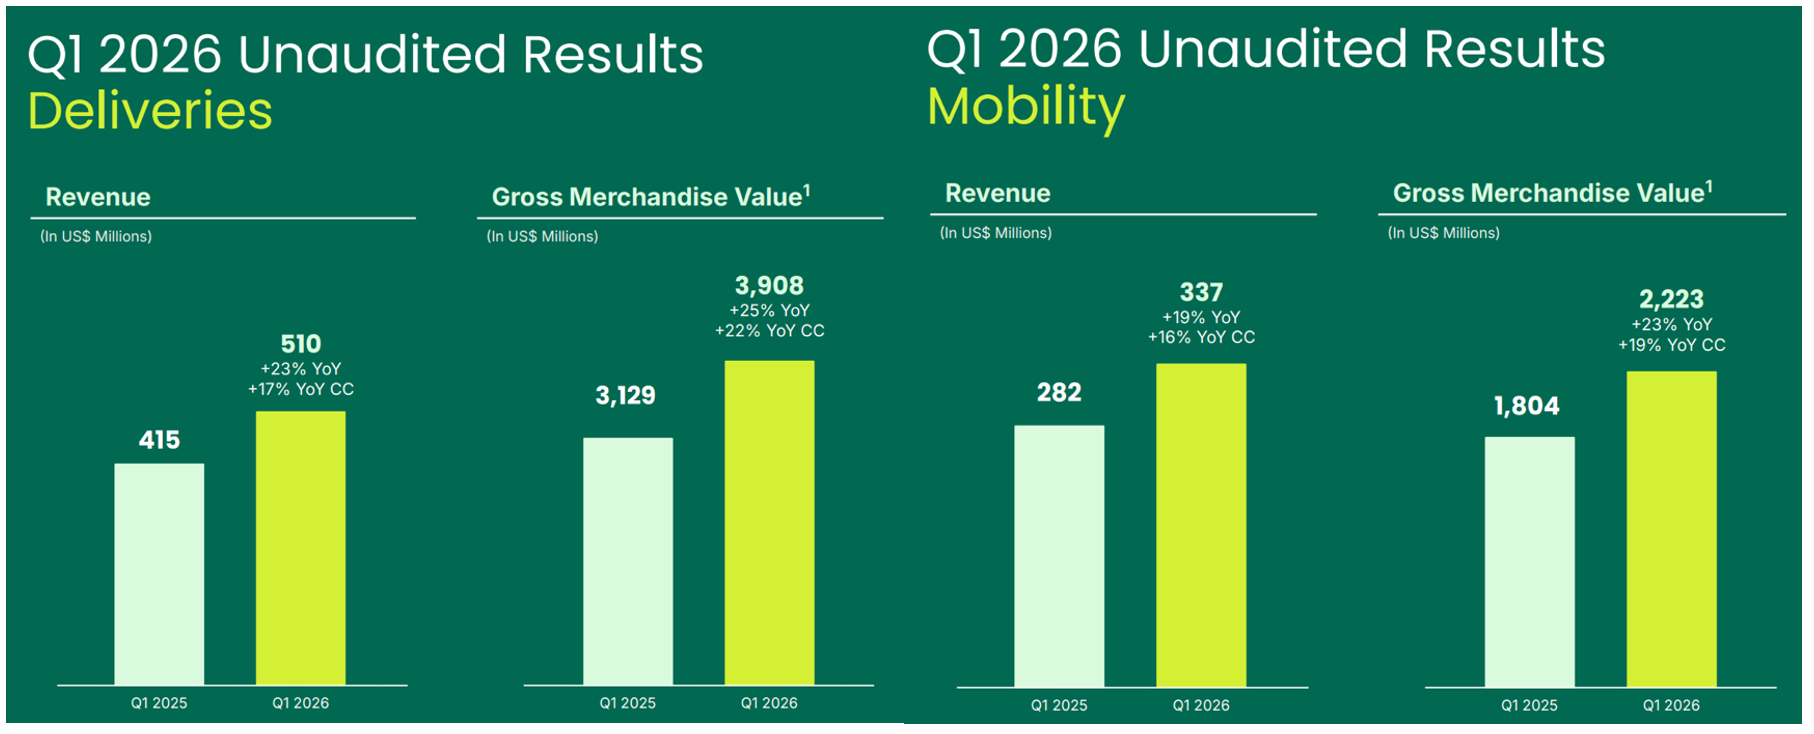
Deliveries GMV grew by 25% or 22% FXN to $3.9B while revenue grew 23% or 17% FXN to $510M.
Mobility GMV grew by 23% or 19%, FXN to $2.2B, while revenue grew 19% or 16% FXN to $337M.
For both segments, GMV grew faster than revenues, which clearly means that Grab’s take-rate shrank this quarter.
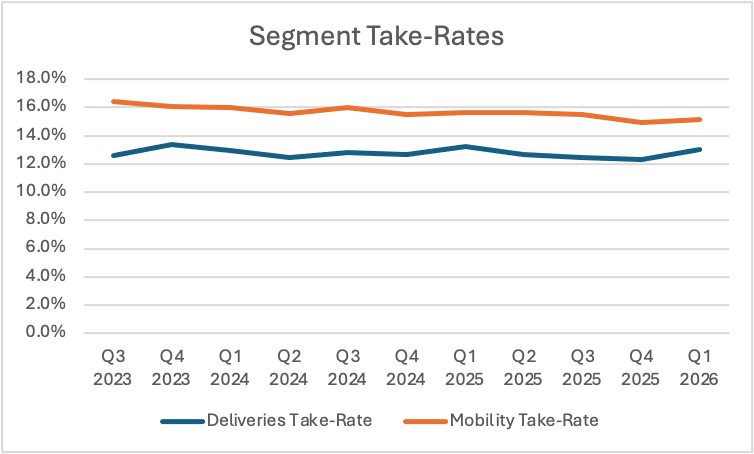
On a Y/Y basis, deliveries take-rate fell from 13.3% to 13.1%, while mobility take-rate fell from 15.6% to 15.2%.
However, on a Q/Q basis, both increased slightly from Q4 2025. This is not that spectacular, as the take rate in Q4 2025 was lower due to seasonally higher incentives related to the Christmas and New Year festivities discounts.
The deliveries segment benefited from the growth in GrabMart and a strong advertising business.
In mobility, the number of active driver-partners grew to an all-time high, increasing 16% Y/Y.
This helps ensure that users can always find a ride quickly. However, the high cost of fuel and new rules in Indonesia became the main topics of concern during the quarter.
One interesting highlight was the growth of GrabMart, which continues delivering strong results.
GrabMart GMV is now 10% of the total deliveries GMV and is growing 1.7 times faster than food delivery.
People who use the app for groceries tend to order 1.8 times more often than people who only order food. This helps Grab build a stickier relationship with its users.
Looking at Segment ADJ EBITDA, deliveries grew by 40% Y/Y to $88M, while mobility grew by 24% to $198M!
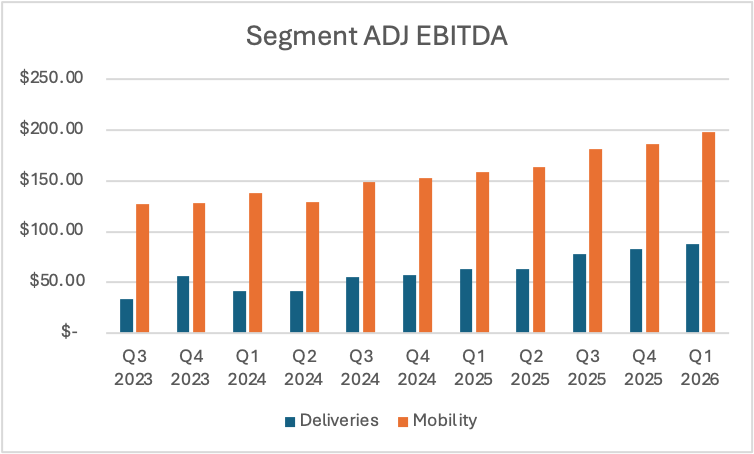
In the graph above, we see that despite various challenges, the mobility segment continues to be a profit driver for Grab, delivering ADJ EBITDA that’s more than double that of deliveries.
However, the delivery segment is growing at almost double the pace and will likely overtake the mobility in the long term.
There were 2 huge changes that affected Grab’s business this year:
Iran War
Take-rate law change in Indonesia
3.1. Iran War
On 28, February 2026, the Iran War began, causing a major shock to the global energy market.
The Strait of Hormuz, where about 25% of the world’s oil passes through, was closed/ This caused crude oil prices to jump over close to $100, reaching peaking at $120, but stabilising at around $100.
This fuel crisis had a direct impact on Grab’s driver-partners across its core markets.
When fuel prices go up, drivers make less profit from each ride.
To keep the drivers working and the marketplace healthy, Grab had to take several countermeasures:
Targeted earnings support: Grab gave extra money and fuel rebates to drivers to help them with the high costs.
Incentive peaks: Because of the fuel crisis and the holidays, total incentives reached a record $650M this quarter. Management expects this to be the peak and that incentives will go down in the next quarters.
Turbo AI mode: Grab introduced a feature called Turbo for drivers. Drivers who used this AI tool to find better routes and rides saw their earnings per hour go up by 23%.
EV transition: The high fuel prices are forcing Grab to move faster toward EVs. They are partnering with companies like BYD and GAC to help drivers switch to EVs, which are cheaper to run than gas cars.
Price and fees: If fuel prices stay high, Grab said they might have to raise prices for customers or add new fees. However, they want to do this carefully so people don’t stop using the app.
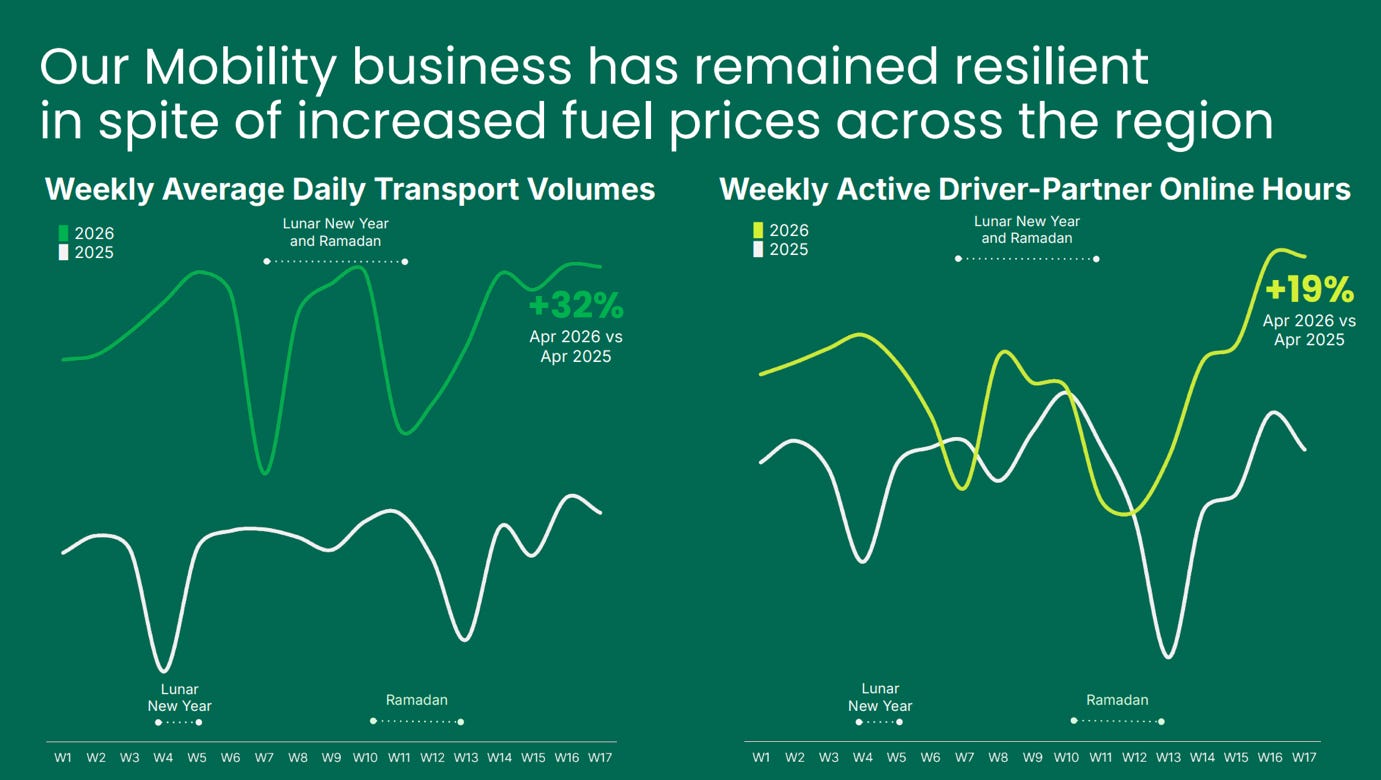
Management said that despite the war and high fuel prices, the demand for rides remained strong in April.
Weekly average transaction volumes were up 32% compared to last year, and total weekly active driver partner online hours were up 19%.
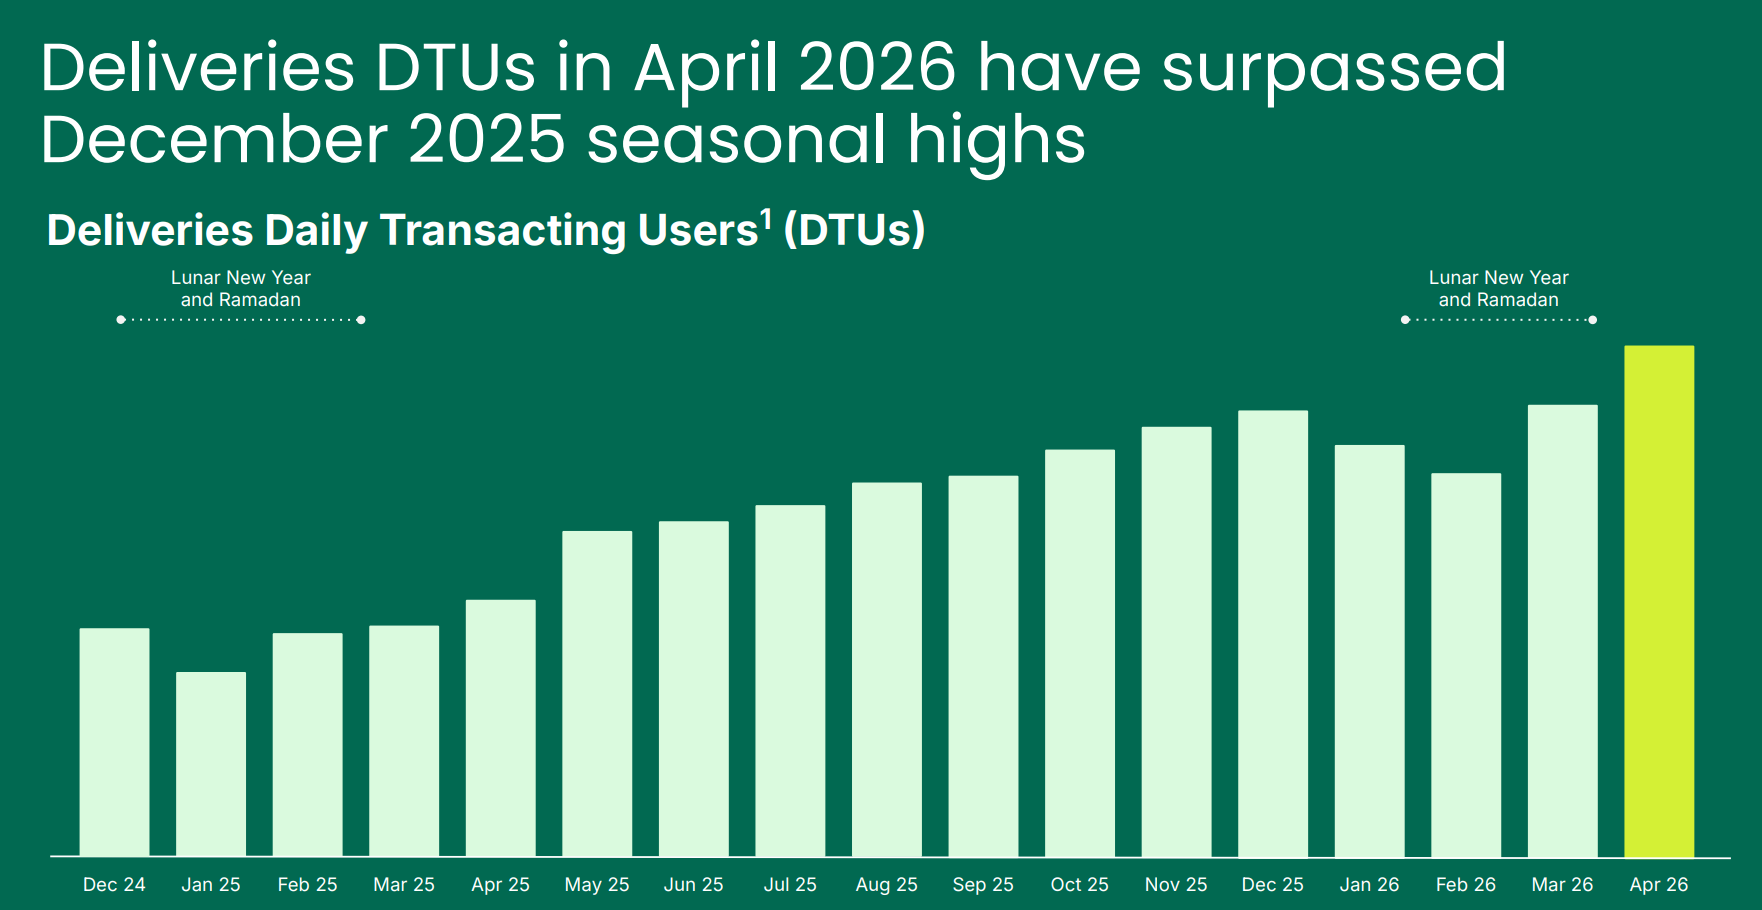
Meanwhile, delivery daily transacting users were not only up compared to Q1 2025, but also up from December 2025 seasonal highs.
This is a clear signal that there is massive untapped demand that Grab still can reach, despite temporary cost shocks.
3.2. Take-Rate law change in Indonesia
On May 1, 2026, Indonesia’s President Prabowo Subianto announced a big change for the ride-hailing industry, signing a new rule that cuts the maximum commission that companies like Grab can take from drivers.
Commission reduced from 20% to 8%
Mandated health and accident insurance
This is potentially a 60% decrease in Grab’s revenues!
However, Grab confirmed in the earnings call that this rule applies only to 2-wheeled mobility drivers.
Grab pointed out that motorcycle rides in Indonesia account for less than 6% of their total mobility GMV. This means they have other parts of the business that are not affected by this new rule.
Nevertheless, this is a major change because it means Grab gets much less money from every motorcycle ride in Indonesia. This move was a response to years of protests by drivers who wanted better pay and working conditions.
Grab is working on several potential countermeasures to reduce the impact on profitability, including:
Shift to advertising: Grab is moving away from making all its money from ride commissions. They are now selling more ads to merchants and other brands. The average spend per advertiser grew 44% this quarter.
New fees for customers: To make up for the lost commission, Grab might increase platform fees or service fees that the customers pay. It is unclear yet if the new rule prohibits this or not.
Higher prices: Fares in Indonesia might have to go up. Grab’s CFO said they will need to recalibrate the business model for two-wheelers in Indonesia.
Reduce incentives: Grab pays hundreds of millions of dollars to drivers in various bonuses, which are not regulated by the government. If the government forces Grab to give a larger take-rate, one option is to simply reduce these incentives.
Grab is currently talking to the Indonesian government to understand exactly how and when the new rules will be put in place.
This could become a bigger issue than it might seem, depending on how the rules are implemented and how other regional countries react.
This could be nothing but theater by the president to improve his approval rating with millions of drivers and lower-income people who don’t understand how businesses work.
If Grab can simply increase platform or processing fees, then the real take-home pay and take-rate for drivers won’t see meaningful increases.
However, if the president is serious and bans additional fees, then Grab could be in trouble.
While Grab said it applies only to 6% of Indonesia’s mobility GMV, which could be about 1-2% of total GMV. However, the issue with government regulations, especially in low-income emerging countries, is that it usually tends to go one way, and that is worse. Regular taxi drivers and food delivery drivers also want higher pay and will likely demand similar measures.
Then drivers in the Philippines, Vietnam, Thailand, Malaysia, and other countries will hear about this new rule and demand similar changes.
This could be the beginning of a deteriorating regulatory environment.
4. Financial Services
Southeast Asia is a very promising region to grow a technology-first financial services business. Depending on estimates, around 50% of the population doesn’t have access to a bank account, and another 20% only have access to limited financial services.
Overall, this cohort of adults contains close to 300M people, thus, Grab has made it their key growth pillar.
Financial services revenue grew by 43% Y/Y to $107M!
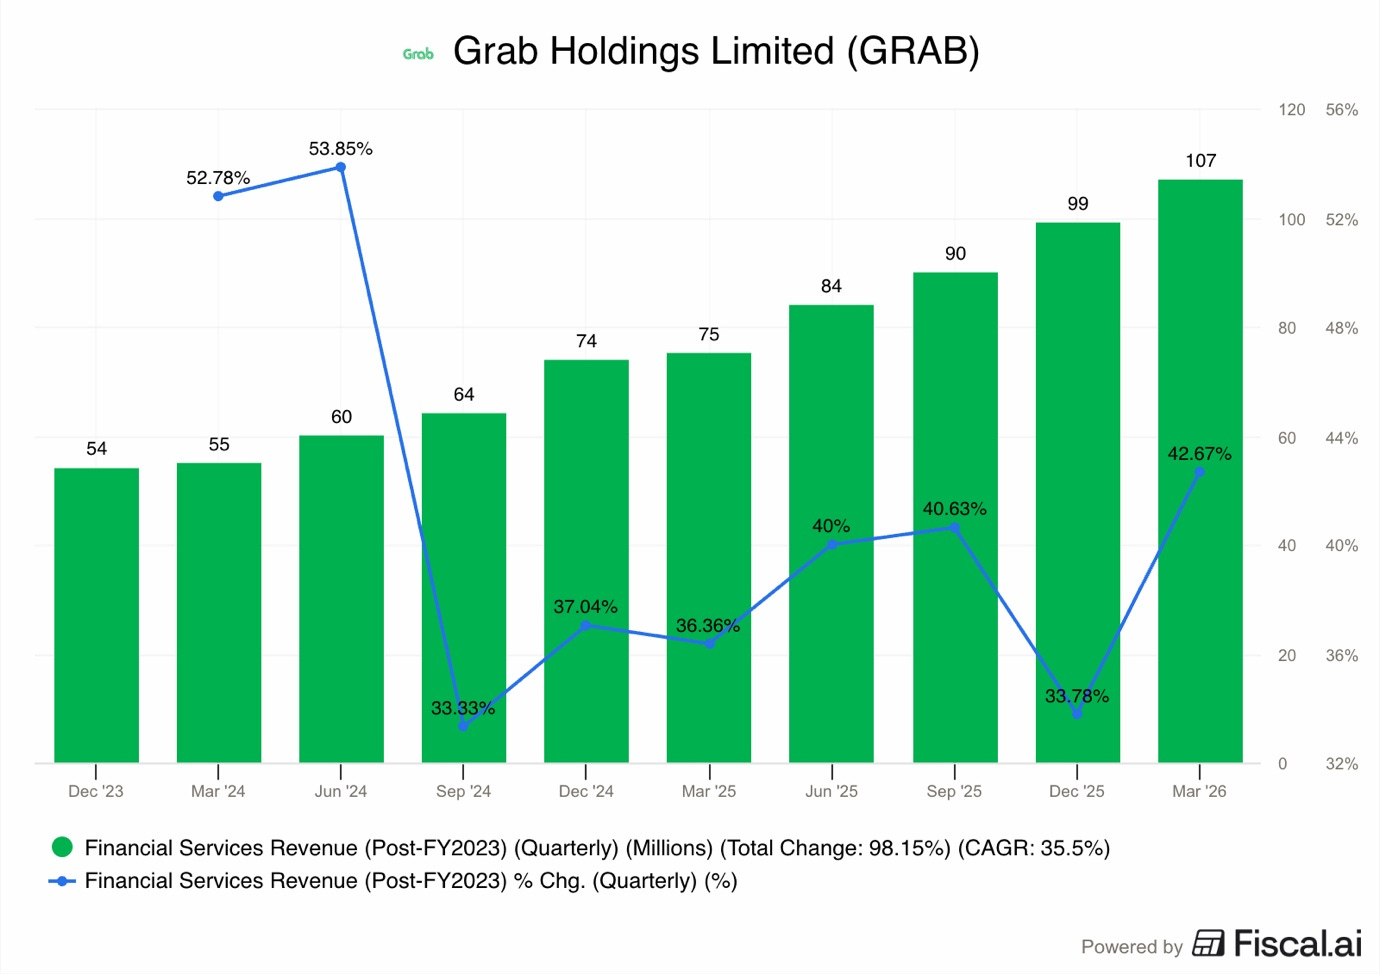
We can see in the chart above that this is a meaningful acceleration from 33.8% in Q4 2025 and 36.4% in Q4 2025.
However, honestly, I am a bit disappointed that they didn’t hit 50% growth. At $107M a quarter scale, this segment is still small. Considering the TAM the company has, I would expect them to grow much faster.
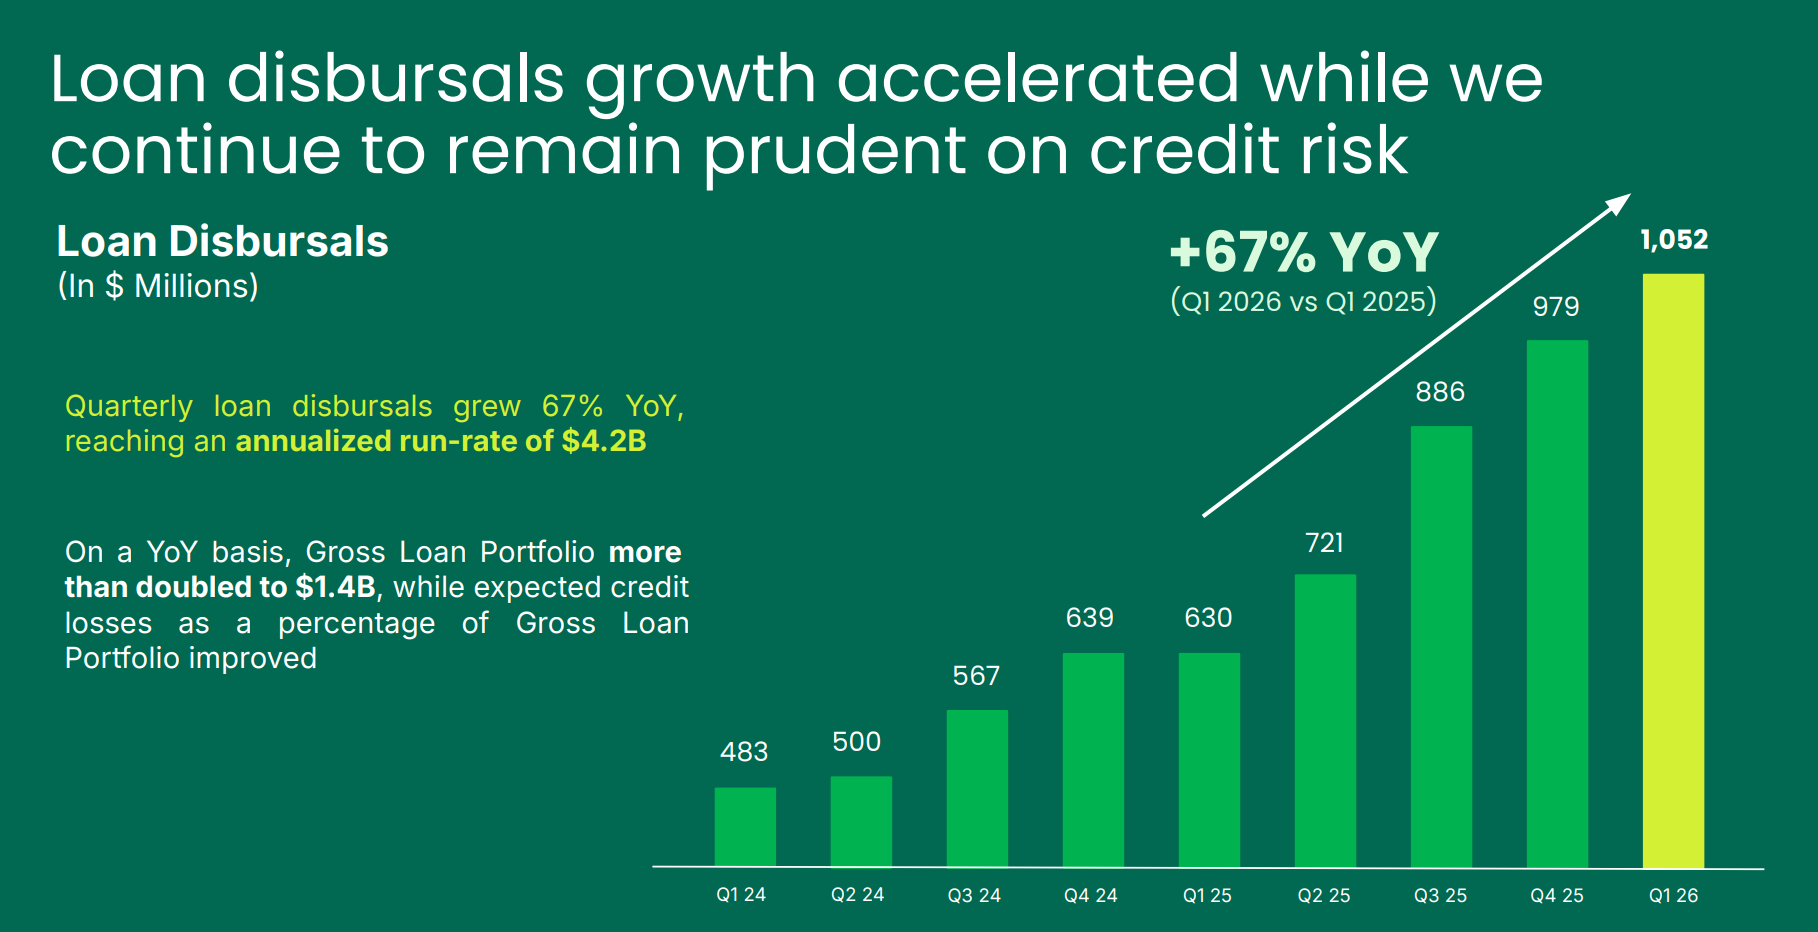
But what impressed me the most is the strong growth of the loan disbursals, which expanded by 67% to reach $1.05B!
This is what I said last year in my Grab company Deep Dive regarding this segment.
“Grab’s mobile-first, automated, digital platform has the potential to originate billions of dollars in loans from its network of restaurants, drivers, merchants, and customers at much lower origination costs than other financial institutions. “
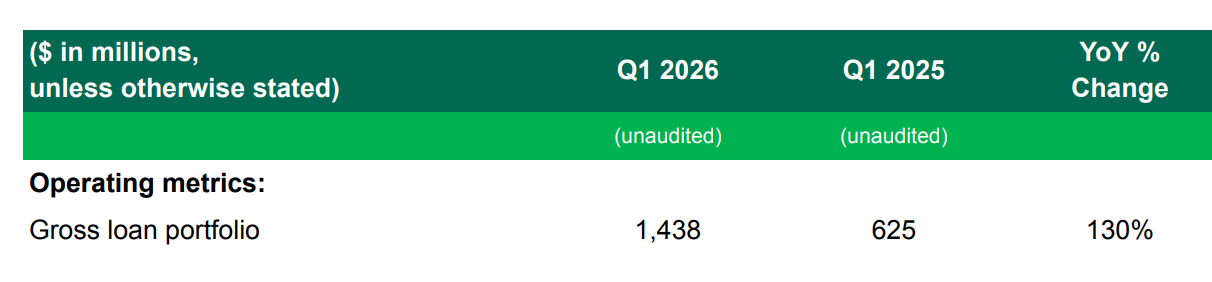
This quarter, Grab demonstrated how this is done, as gross loan portfolio grew by 130% to $1.4B. The company is targeting $2B by the end of the year.
Furthermore, Grab reported that customer deposits grew from $1.4B to $1.6B, only 14% Y/Y.
Also, a bit disappointing.
“we actually don’t have any issue at all in raising deposits….. If you look at the pricing of our deposits, we are never the most aggressive in the market. We’re able to actually gather sufficient deposits to create the right shape of balance sheet. There’s no point in having excess deposits, particularly in this yield curve environment. What you’re seeing is us carefully managing the level of deposits to make sure that we optimize for P&L purposes. If we needed to raise more deposits, we’re very confident that we can do that.“ Alex Hungate, Grab COO
Grab said that they are satisfied with their deposit base and are not chasing deposit growth with aggressive discounts. Essentially, Grab has enough cash to satisfy the demand it has for its loans, and the company doesn’t want to overpay for deposits.
This is because the financial segment is unprofitable, and Grab wants to reach profitability soon.
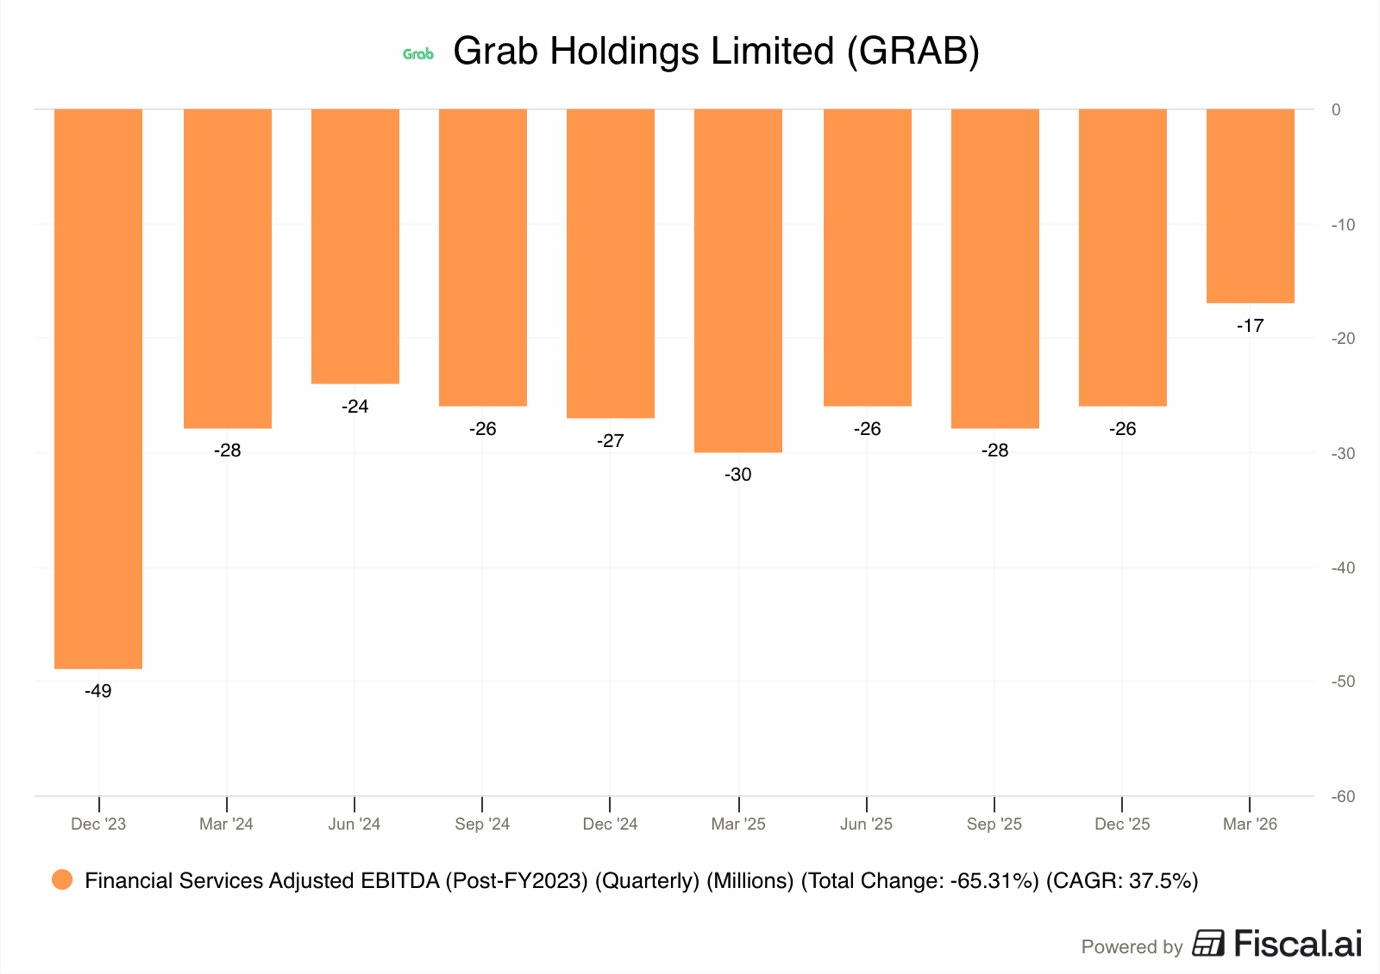
The segment lost $17M in Q1 2026, which is an improvement compared to $26 it lost in Q4 2025 and $30M in Q1 2025.
ADJ EBITDA margin improved from -26% in Q4 2025 and -40% in Q1 2025 to -16% in Q1 2026!
I am not sure if prioritizing the segment AJD EBITDA break-even on the account of deposit and market share growth is the right long-term strategy. The management clearly believes this to be the right strategy.
It could be that the current disruptions in Iran are affecting their thinking, as stronger investments to create growth in the financial services segment could lead Grab to be unprofitable on the group level, and the management clearly doesn’t want that.
5. Incentives
Incentives are the discounts Grab gives to customers and the extra money they pay to drivers. Both are designed to drive GMV growth by driving customer demand and driver supply.
In Q1 2026, total incentives were $650M +29.7% Y/Y over $501M spent last year!
A reminder that under IFRS accounting, these incentives are not recorded as costs on the income statement, but rather as a reduction of revenue. So by reducing incentives, Grab could drive stronger revenue growth, but we are not seeing that right now.
Below, we can see how incentives are split across mobility, deliveries, drivers, and consumers.
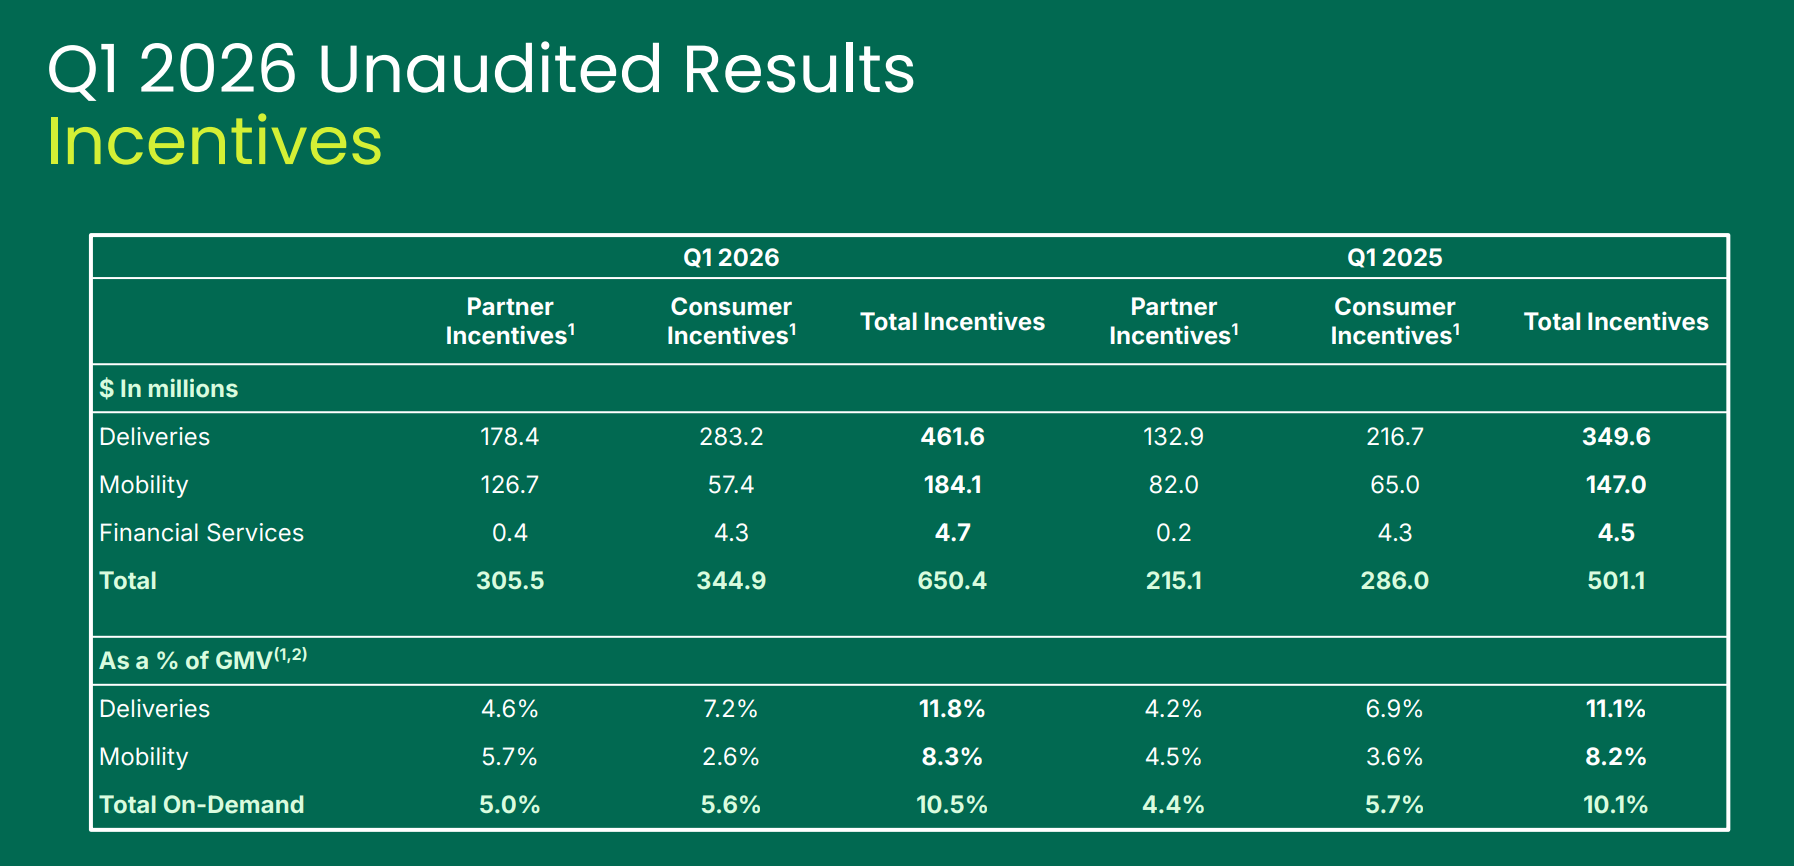
Driver partner incentives grew by 42% Y/Y to $305M, largely because of higher fuel bonuses from Grab!
Meanwhile, consumer incentives grew by 21% to $345M, largely because of the 31% growth in delivery consumer incentives.
There were two main reasons why incentives went up this quarter.
First, the holidays caused supply pressures, as Grab had to pay drivers more to stay on the road. Last quarter, there were the Chinese and Thai traditional calendar new year celebrations, when drivers from major cities often return to their home provinces and villages to visit family. Additionally, there was Ramadan, which affected some muslim drivers.
Second, the fuel crisis caused by the war in Iran made fuel very expensive, so Grab gave drivers extra support to make sure they could still afford to work.
As a percentage of On-Demand GMV, incentives rose to 10.5%, compared to about 10% a year ago.
Grab’s management believes that Q1 2026 was the peak for incentives.
They expect that as fuel prices normalize and they use more AI tools like Turbo, they won’t need to spend as much on incentives in the future.
6. Taiwan
A reminder that a few months ago, Grab acquired Foodpanda’s Taiwanese food delivery business.
This was a smart deal and an interesting opportunity.
I analyzed the deal in my previous report. Please find it below.

7. Conclusion
Despite the oil shock, Grab had a strong start to 2026!
The company reached a record $154M in ADJ EBITDA and saw its revenue grow by 24%.
They were able to manage a sudden fuel crisis caused by the war in Iran and still keep their driver supply at an all-time high. The growth of financial services into a $1B+ quarterly lending business shows that Grab is successfully becoming a fintech.
However, the growth of the fintech business is too slow considering the scale.
At $107M revenues a quarter scale, it should be growing much faster than 43% Y/Y. Grab must meaningfully accelerate the fintech business, or it risks missing the fintech opportunity.
Furthermore, the future has some big challenges, especially with the new 8% commission cap in Indonesia and the ongoing high fuel costs.
However, Grab is using AI and advertising to build new ways to make money that don’t depend only on ride commissions.
Additionally, by keeping its guidance the same, which was given before the Iran war, Grab is telling the investors that it is built to survive and grow even when times are tough.
Investors are still cautious, but the company’s progress toward becoming a highly profitable regional player in mobility, food delivery, and finance remains very clear.
It’s been 6 months since I published a Grab valuation model, I think it's time for an update.
So I will publish a new one tomorrow for my premium subscribers!


Here is what my Premium Members can expect:
Portfolio Review - Each month, I will present the portfolio performance and discuss my stock watchlist and my best ideas.
Recent developments.
Unwarranted pullbacks.
Insider activity.
Potential catalysts.
Deep Dives – 8,000+ word detailed analysis of a company, delivered in 3 Parts.
Part 1 – Brief History of the company and its Business Model.
Part 2 – Management, Moats, Competitors, and Risks.
Part 3 – Opportunities, Financial Analysis, and a Valuation Model.
You can expect a comprehensive research report that is educational, interesting, and provides actionable insights!
To see what you can expect, read my Palantir Deep Dive!
Members of the Premium service get access to my library of 12 Deep Dives and to all future Deep Dives, which will be released on semi-monthly basis.
Investment Cases – A short, concise report with actionable insights.
This report is about the size of a single part of a Deep Dive.
Focused Investment Thesis
Main drivers of the Bull Case
Valuation Model
To see what you can expect, read my Oscar Health Investment Case!
Earnings Reviews and Updates – For companies that are of great interest to me and my readers, I will provide regular quarterly or semi-annual updates after earnings reports.
Financial performance
Business Update
New developments
Updated Valuation Model
To see what you can expect, read my Google Q2 2025 Earnings Review!
Equity Research Report List
You can follow me on Social Media below:
X(Twitter): TheRayMyers
Threads: @global_equity_briefing
LinkedIn: TheRayMyers
Disclaimer: Global Equity Briefing by Ray Myers
The information provided in the “Global Equity Briefing” newsletter is for informational purposes only and does not constitute financial advice, investment recommendations, or an offer or solicitation to buy or sell any securities. Ray Myers, as the author, is not a registered financial advisor, and readers should consult with their own financial advisors before making any investment decisions.
The content presented in this newsletter is based on publicly available information and sources believed to be reliable. However, Ray Myers does not guarantee the accuracy, completeness, or timeliness of the information provided. The author assumes no responsibility or liability for any errors or omissions in the content or for any actions taken in reliance on the information presented.
Readers should be aware that investing involves risks, and past performance is not indicative of future results. The author may or may not hold positions in the companies mentioned in the “Global Equity Briefing” report. Any investment decisions made based on the information in this newsletter are at the sole discretion of the reader, and they assume full responsibility for their own investment activities.